
How to Conduct Research: 8 Essential Steps & Best Practices
Learn how to conduct research properly with 8 essential steps. Complete guide covering research process from problem identification to sharing findings.
By Dr. Leonard Cucos
en
Explore our collection of tutorials on statistics, research methods, and data analysis.
Learn how to conduct research properly with 8 essential steps. Complete guide covering research process from problem identification to sharing findings.

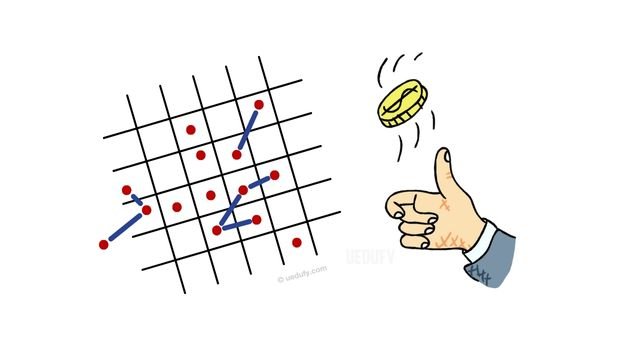
Learn how to take a simple random sample in 4 steps. Includes definition, examples, Excel/SPSS/R methods, and when to use simple random sampling.

Learn what a null hypothesis is, its symbol (H₀), and when to use it. Includes definition, examples, how to write it, and when to reject or accept.

Learn what research is with clear definition and 8 key characteristics. Includes examples, types, and the difference between good and poor research.
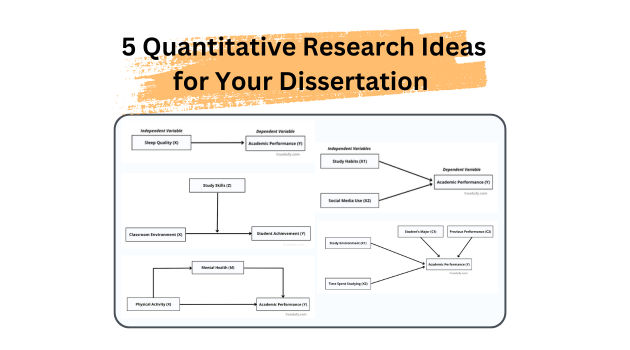
Explore 5 complete quantitative research ideas with research questions, hypotheses, variables, methodology, and data analysis. From simple correlation to mediation and moderation.
![What is T-Test? Definition, All 3 Types, and How to Read T-Test Values [Complete Guide]](/images/blog/en/featured/what-is-t-test.png)
T-test is a statistical test used to compare means of groups. Learn the definition, all 3 types (One-Sample, Paired, Independent), formulas, and how to read p-values in this complete guide.
![How to Do T-Test in Excel: Complete Guide for All 3 Types [One-Sample, Independent, Paired]](/images/blog/en/featured/t-test-in-excel-complete-guide.png)
Learn how to perform t-test in Excel with step-by-step formulas for all 3 types: One-Sample, Independent Samples, and Paired t-tests. Includes downloadable Excel template and complete interpretation guide.
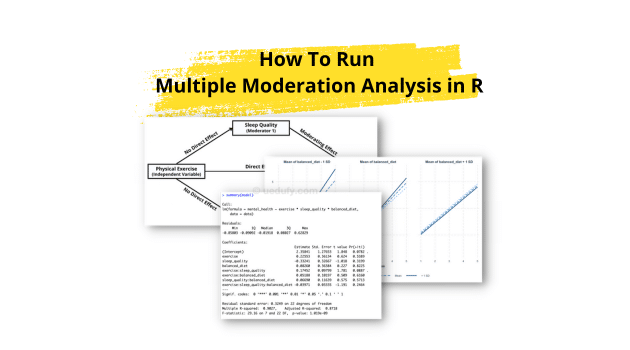
In this lesson, we will learn how to run multiple moderation analysis in R. By exploring the impact of multiple moderators, we can deepen our understanding of the dynamics between our variables of interest and shed light on potential interactions. Statistical analyses often reveal intriguing relationships between variables. However, relationships among variables are usually more [...]
Learn how to import CSV files into R and RStudio in 6 easy steps. Master both GUI and code methods using read.csv() function. Includes step-by-step guide with screenshots, FAQ, and best practices for loading CSV data in R.
Learn how to import Excel files into R and RStudio in 6 easy steps. Master both GUI and code methods using readxl package for .xls and .xlsx formats. Includes step-by-step guide with screenshots and code examples.
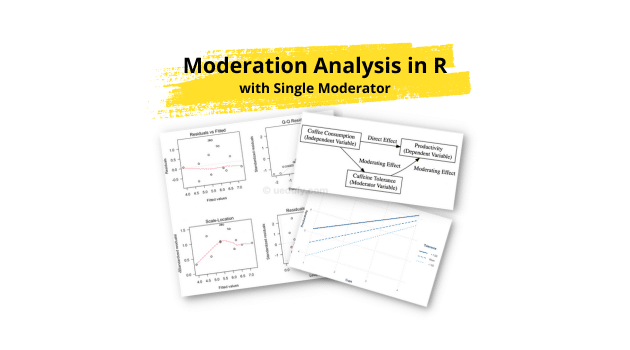
Learn how to run moderation analysis in R with this complete guide. Master moderating variables, moderating effects, moderation models, and moderation analysis assumptions using real data and step-by-step examples.
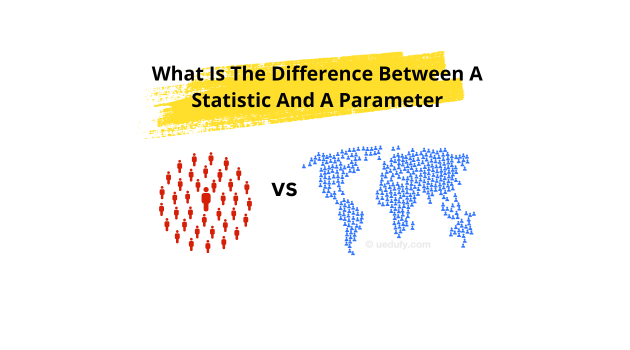
Learn the difference between statistic and parameter in statistics: definitions, notation (μ vs x̄, σ vs s), key differences, real-world examples, and how to identify each in research.
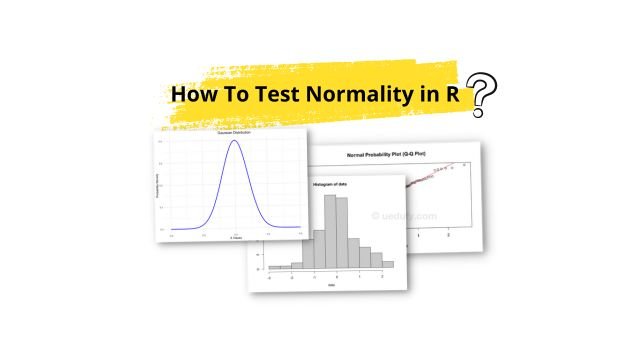
Learn how to test for normality in R using Shapiro-Wilk test, QQ plots, histograms, and Kolmogorov-Smirnov test. Includes step-by-step code examples and complete guide to interpreting normality test results and p-values.
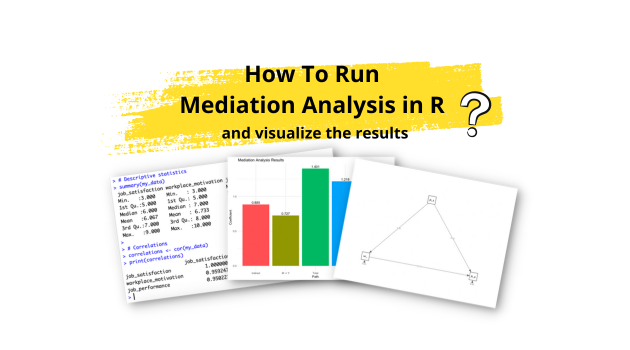
Learn how to run mediation analysis in R using lavaan package in 7 easy steps. Master mediation in R with path coefficients, indirect effects, and professional visualizations. Includes downloadable dataset and complete code examples.
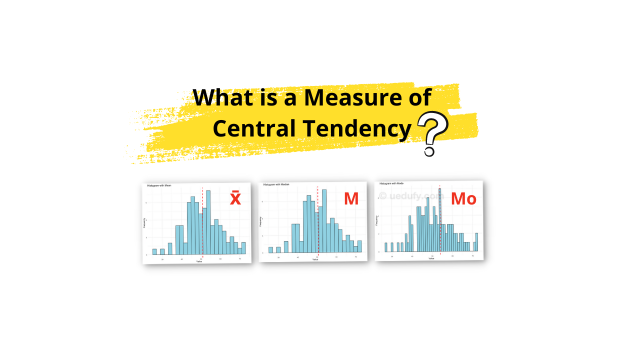
Hey there! If you've ever wondered what is a measure of central tendency, then you're in the right place. We're going to break down this somewhat intimidating term into simple, easy-to-understand pieces. Lesson Outcomes By the end of this article, you should be able to: So, let's dive in! So, What is a Measure of [...]
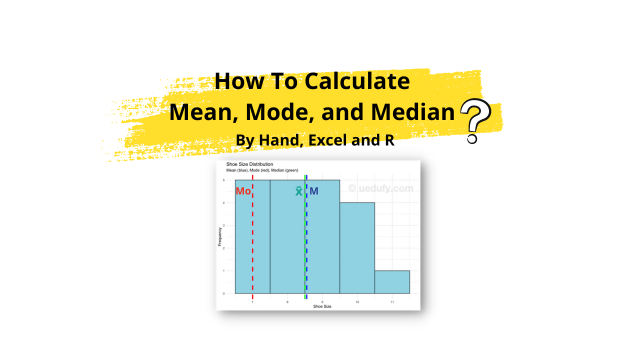
Learn how to calculate mean, median, and mode by hand, in Excel, and in R. Includes formulas, step-by-step examples, the relationship between mean median mode, when to use each measure, and real-life applications of measures of central tendency.
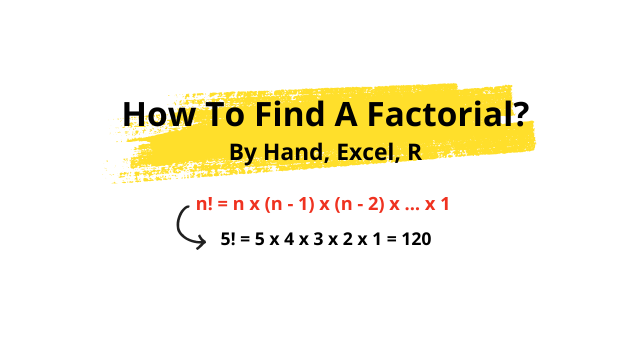
Today, we'll dive into something incredibly exciting – how to find a factorial. Before we get into the details, let's briefly discuss factorials and why they matter. A factorial, typically represented by an exclamation mark (!), is the product of all positive integers up to a given number. For instance, the factorial of 5 (denoted [...]
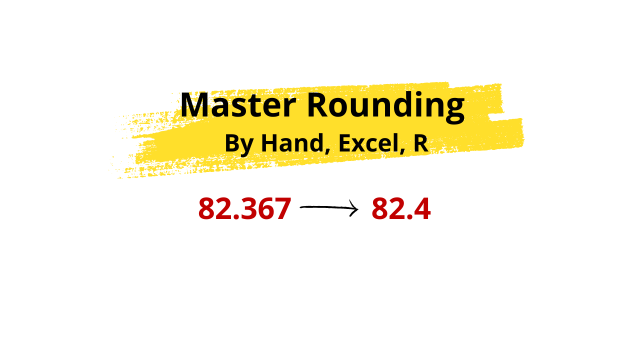
Welcome back to another exciting adventure in the world of numbers and pre-statistics. Today, we're going to learn how to round numbers to X decimal places effortlessly. Lesson Outcome: By the end of this lesson, you should be able to: So, get a cup of coffee or tea, and let's get started! How To Round [...]
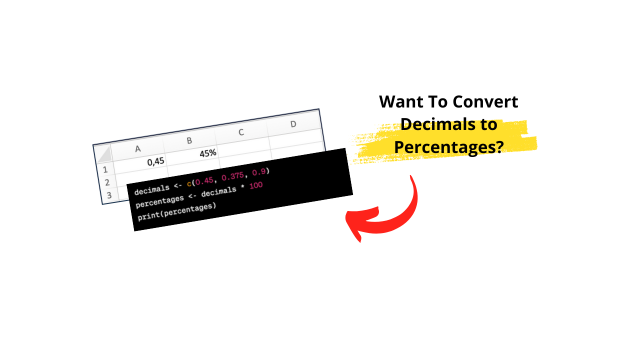
Ready to learn how to convert decimals to percentages in three different ways? In this article, we'll show you how to make that conversion manually, using Excel and R programming. Let's get started! How To Convert Decimals to Percentages Manually Converting decimals to percentages manually is a cinch! Just follow these easy steps: And there [...]
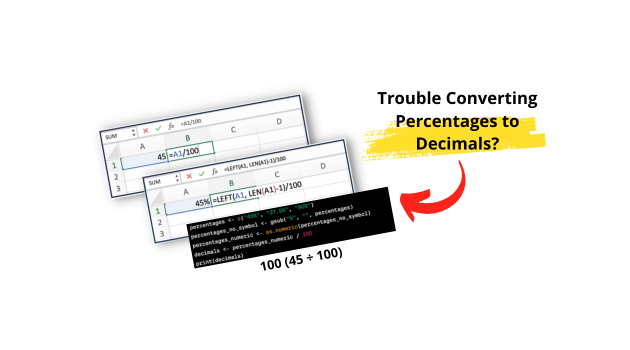
Learn how to convert percentages to decimals using three proven methods: manual calculation, Excel formulas, and R programming. Step-by-step guide with examples for converting percent to decimal format. Includes formulas for Excel LEFT/LEN functions and R gsub operations.
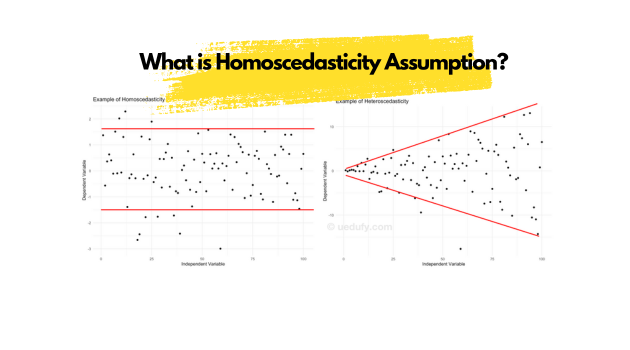
Learn what homoscedasticity means in statistics, why it matters for linear regression, and how to recognize and address violations. Complete guide covering homoscedasticity vs heteroscedasticity, testing methods, and practical solutions.
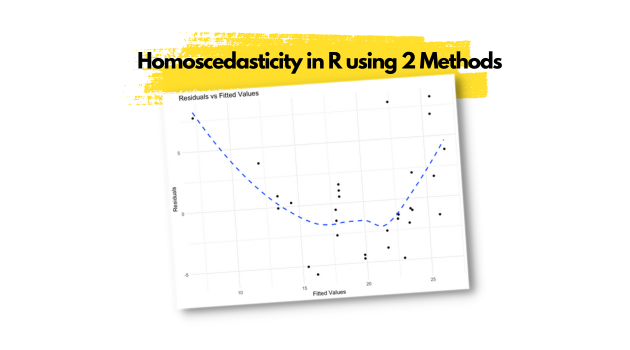
Learn how to test homoscedasticity in R using two proven methods: visual residual plots and the Breusch-Pagan test. This guide covers step-by-step implementation, interpretation, and validation of the homoscedasticity assumption in linear regression models.
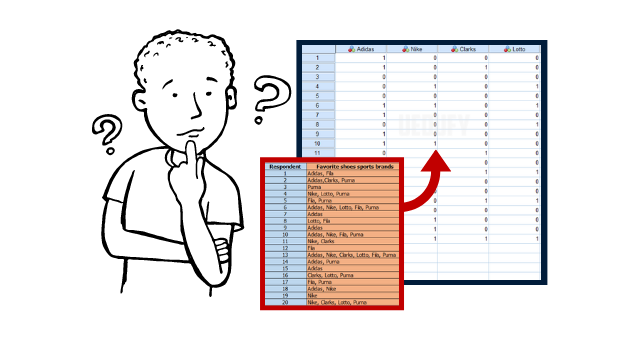
Learn how to enter, code, and analyze multiple response questions in SPSS. Step-by-step tutorial covering data preparation in Excel, defining response sets, running frequencies and crosstabs analysis.
Learn the independence assumption in statistics: definition, why it matters for regression and ANOVA, how to test it using chi-square and Durbin-Watson tests, real examples, and consequences of violations.
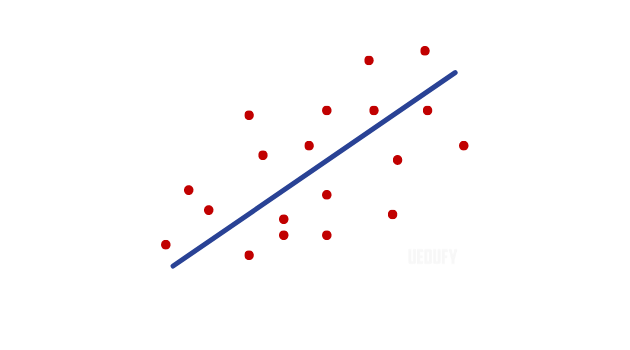
Learn what linearity in statistics means, how to test for linearity using scatterplots and residual plots, and why linearity is crucial for regression analysis. Includes practical examples and step-by-step testing methods.
Learn how to generate random numbers in Excel using RAND and RANDBETWEEN functions. Complete guide with formulas, examples, and techniques for unique random numbers.

Learn what stratified sampling is, when to use it, and how it works. Complete guide with definition, step-by-step procedure, real-world examples, and advantages.
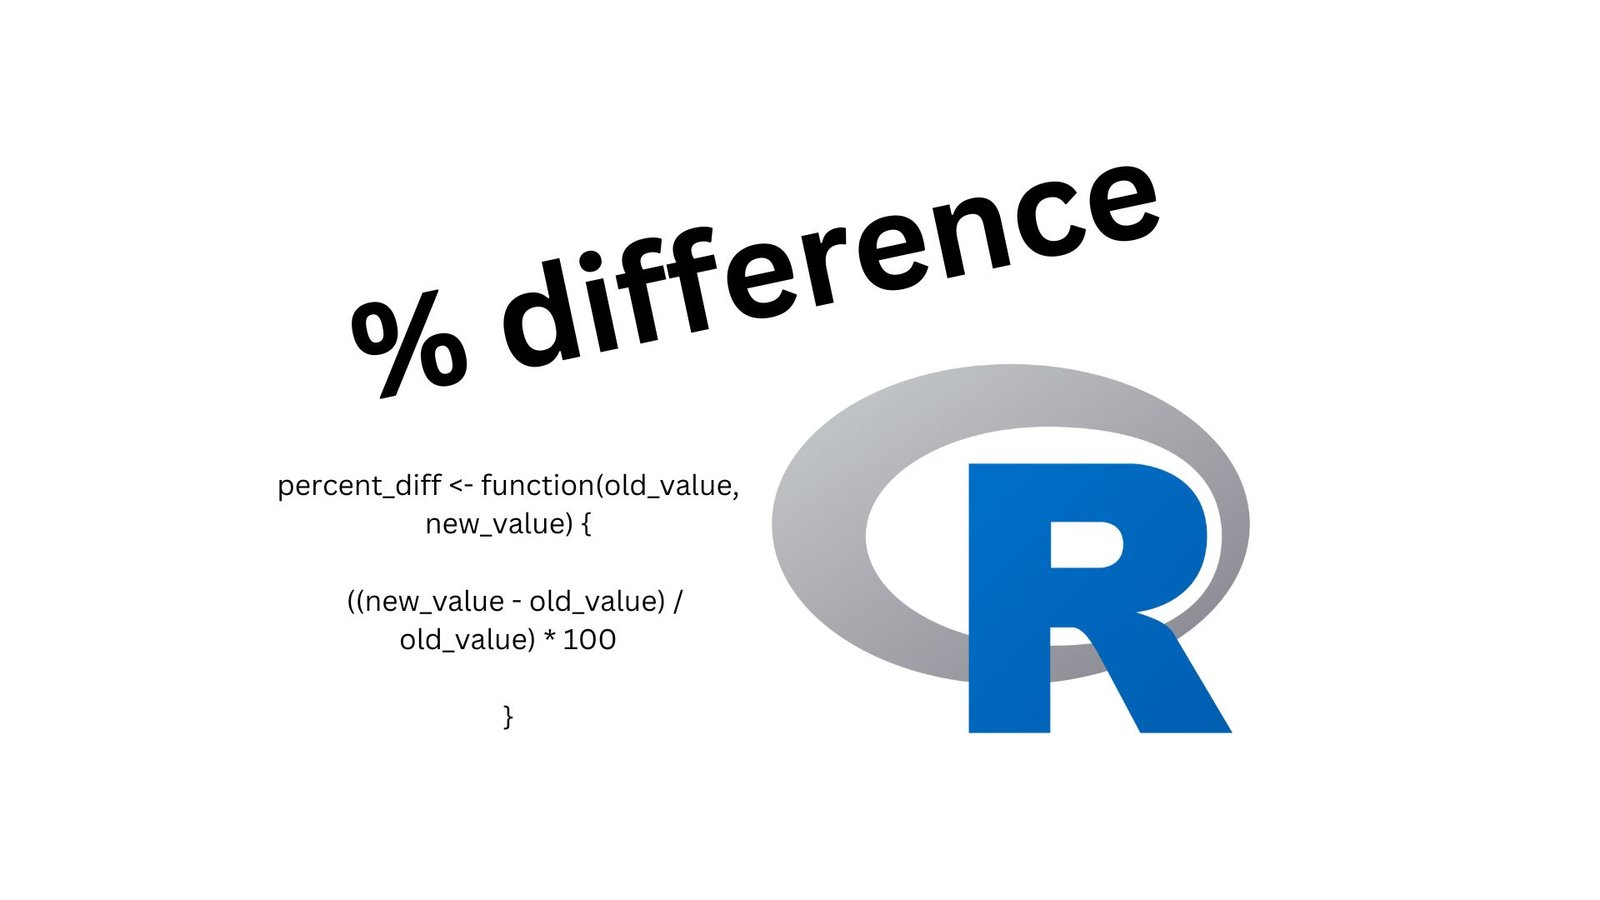
Learn how to calculate percentage difference in R using custom functions and the scales package. Includes complete code examples, the percentage difference formula ((new-old)/old)*100, step-by-step tutorials, and practical applications for data analysis and statistical computing.
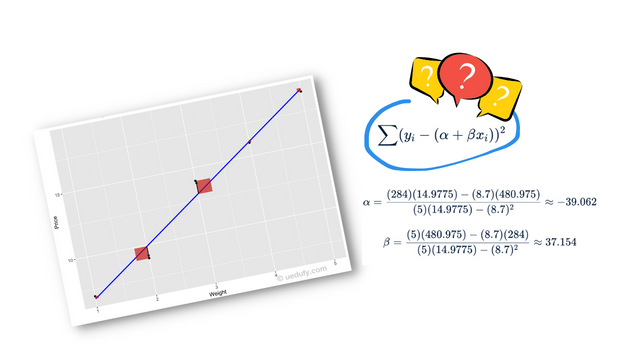
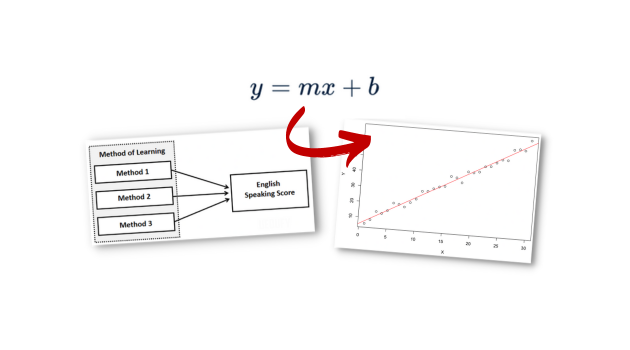
Learn what the least squares regression line is, how to calculate it, and when to use it. Includes formula derivation, step-by-step examples, and interpretation.
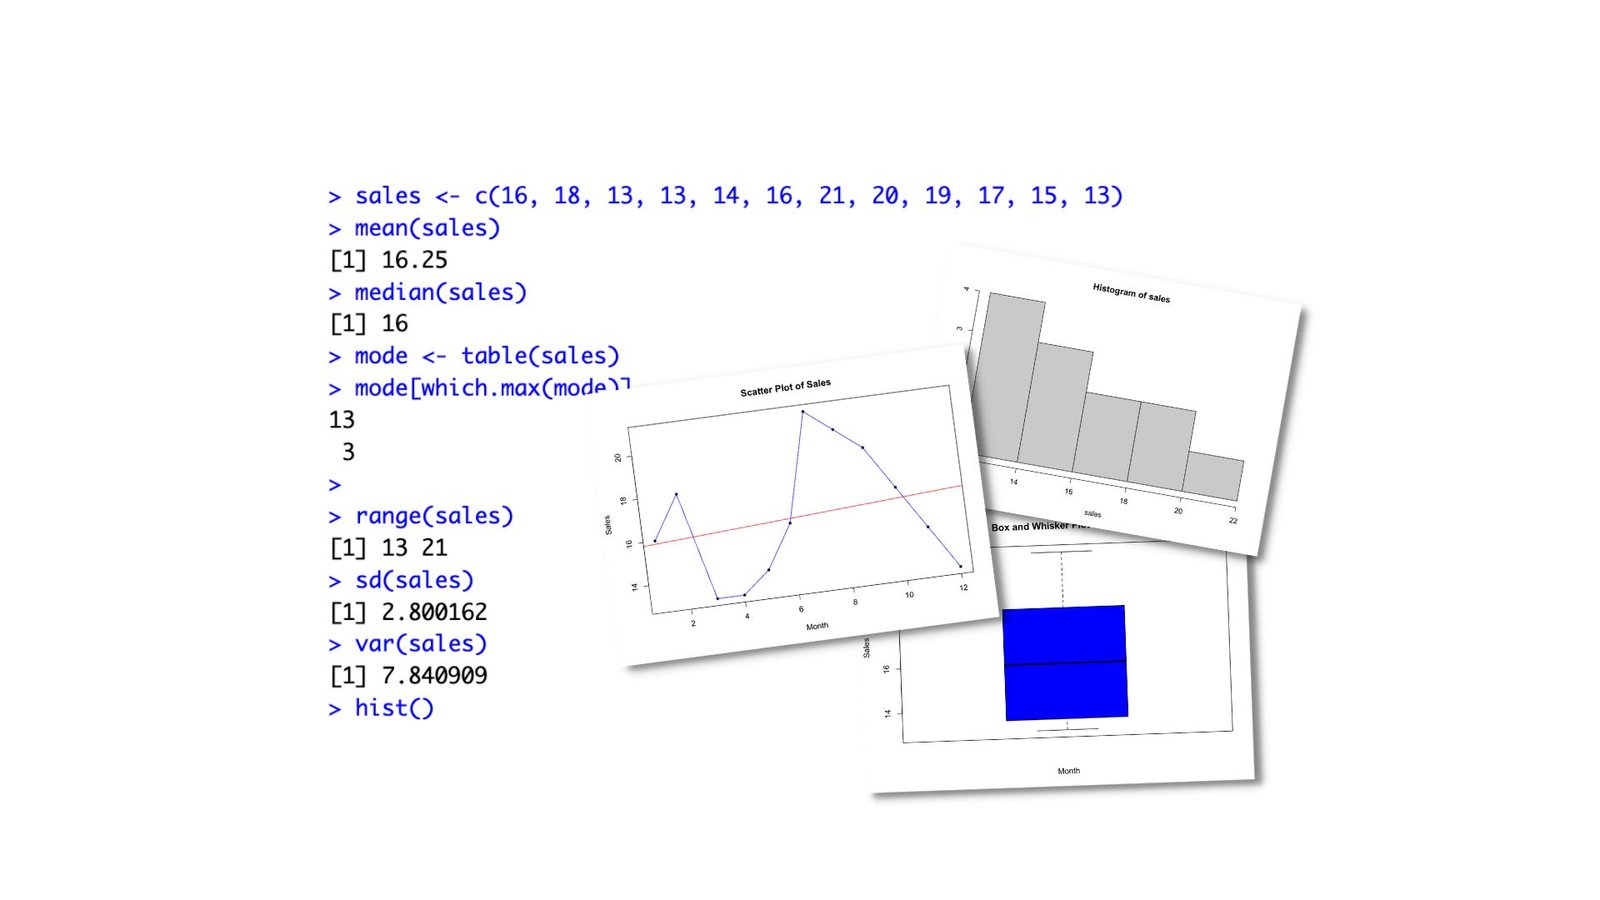
Are you ready to take your data analysis skills to the next level with descriptive statistics in R? Then let's get started! Descriptive statistics are a set of techniques that help us summarize and describe the main features of a dataset. It helps us get a quick and simple understanding of the data, and they [...]
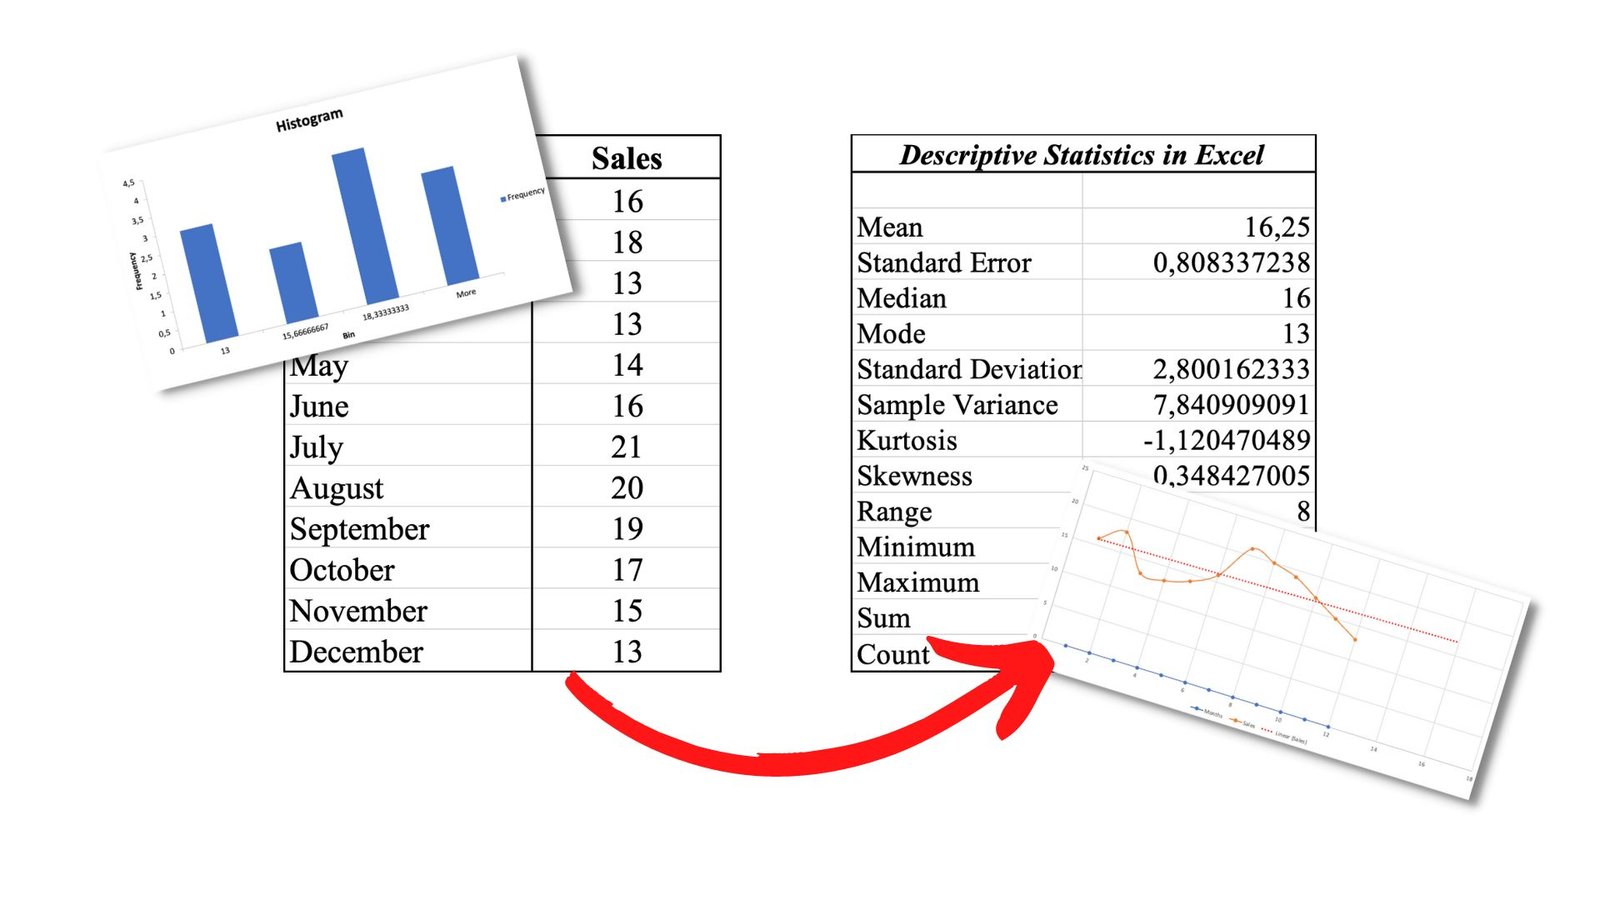
Learn how to calculate mean, median, mode, standard deviation, and variance in Excel using AVERAGE, MEDIAN, MODE, STDEV, and VAR formulas. Includes step-by-step examples, Analysis ToolPak method, and visualization techniques with histograms and box plots.
Learn the scientific method: complete 8-step process, definition, examples, and practical applications in research. Master observation, hypothesis testing, and data analysis.
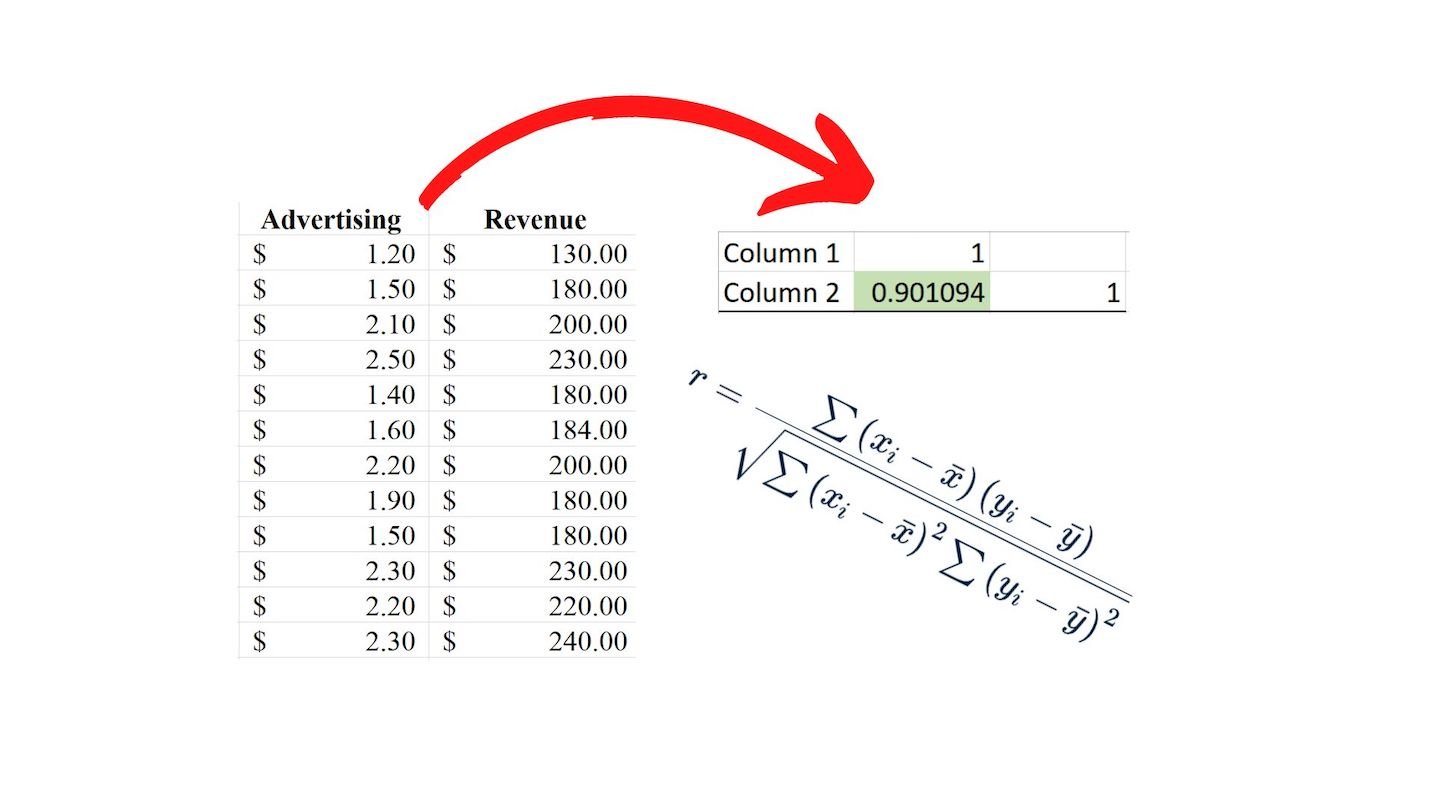
Learn how to calculate Pearson correlation coefficient in Excel using CORREL function and Data Analysis Toolpak. Step-by-step tutorial with screenshots, interpretation guide, assumptions testing, and practice dataset. Includes FAQ on how to interpret correlation results, p-values, and Pearson vs Spearman differences.
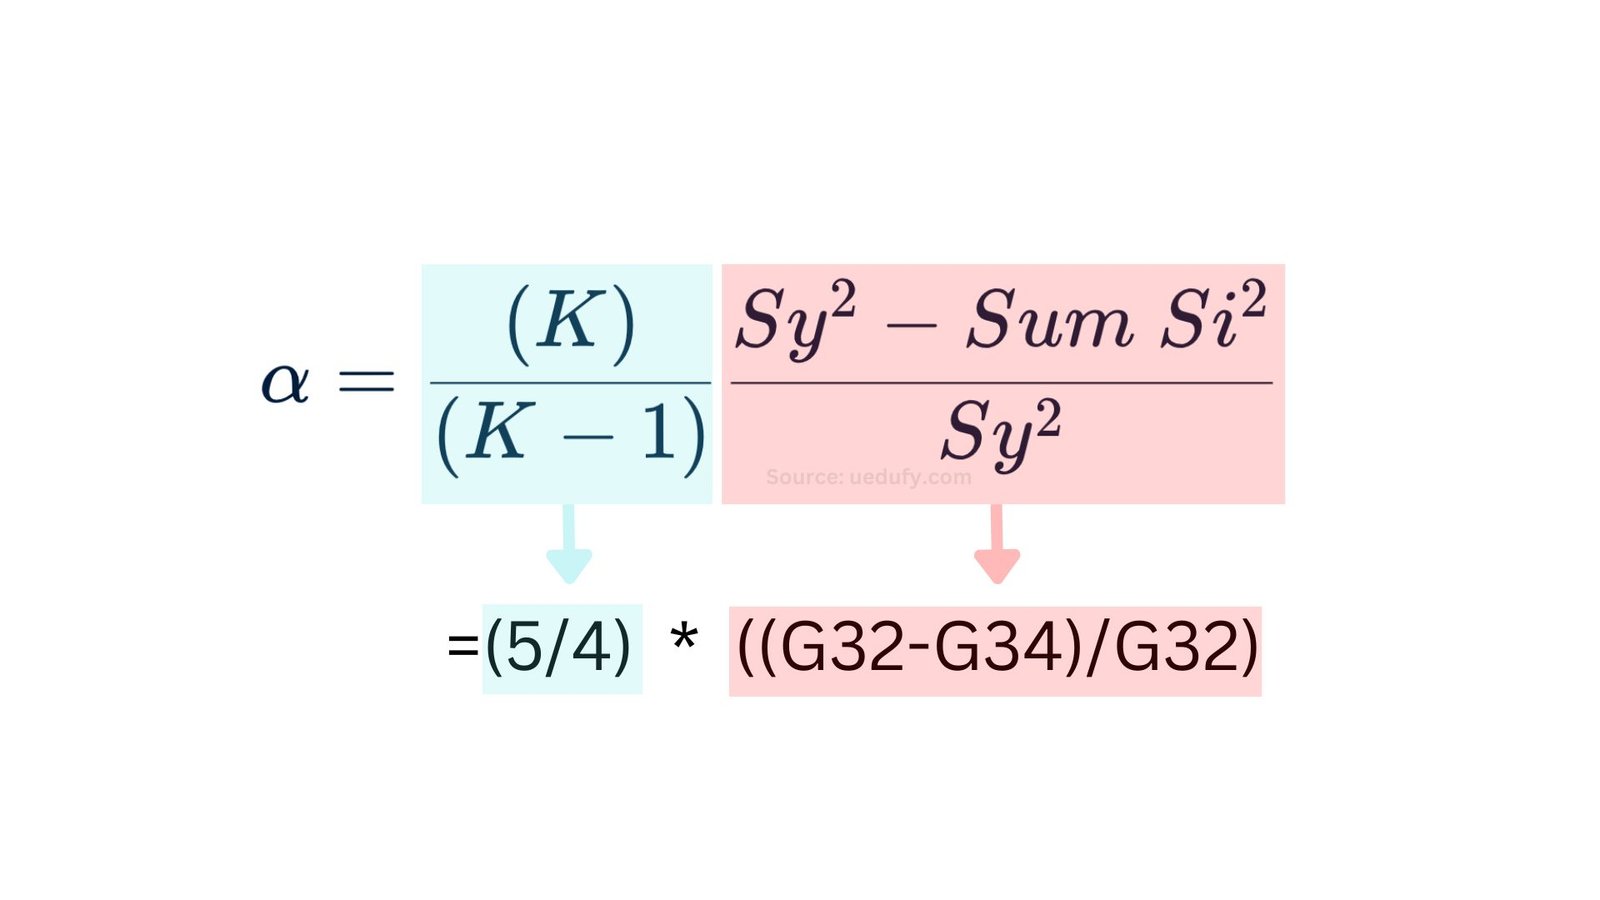
Learn how to calculate Cronbach's Alpha in Excel with our step-by-step formula guide. Includes free Excel calculator template, interpretation table, and comprehensive FAQ for reliability testing.
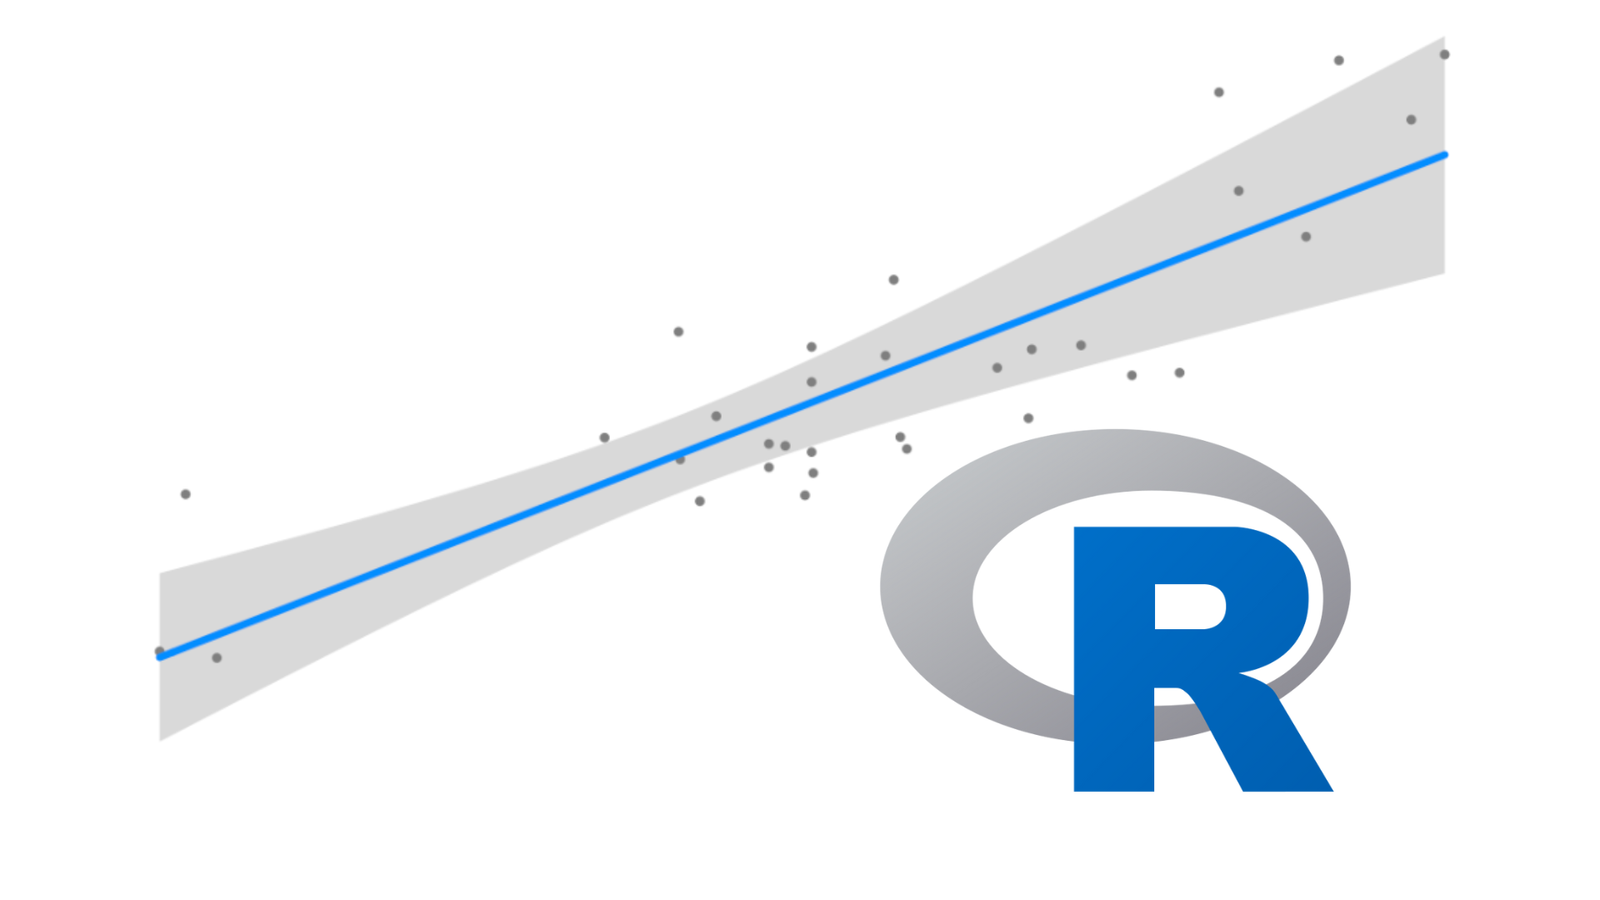
In this practical example of linear regression in R, we will learn how to predict the fuel efficiency of a car based on its weight. We will start by importing a dataset, calculating linear regression using the lm() function and making predictions using the predict() function, and learning how to interpret the linear regression results in R. Though we will [...]

Discover why statistics is important in everyday life through real-world applications in business, healthcare, education, and social sciences. Learn how statistical analysis drives decision-making, improves outcomes, and helps us understand the world. Includes practical examples, uses of statistics, and why understanding data matters.
Learn how to add and install the Data Analysis ToolPak in Excel for both Windows and macOS. Step-by-step instructions to enable Excel's built-in statistical tools for t-tests, regression, correlation, ANOVA, and more. Includes installation guides, troubleshooting tips, and how to remove the add-in if needed.
In this guide, we will learn how to install R and RStudio on Windows, macOS, Linux, and UNIX [FreeBSD] and get our machine ready for some statistical research and data science. The whole R and RStudio installation on all the above-mentioned operating system do not take more than 5-10 minutes of your time. R is [...]
Learn how to install R packages from command line using install.packages(), CRAN mirrors, and GitHub with devtools. Complete guide covers package management, installation paths, masking, and troubleshooting. Includes step-by-step commands for installing, loading, and removing R packages from terminal.
Learn how to run, interpret, and report one-way repeated measures ANOVA in SPSS with step-by-step screenshots. Includes assumption testing, Mauchly's test, within-subjects effects, pairwise comparisons, and APA reporting format with downloadable practice datasets.
Learn how to calculate standard deviation in R using the sd() function. Step-by-step RStudio examples for data frames, vectors, arrays, and Excel datasets.
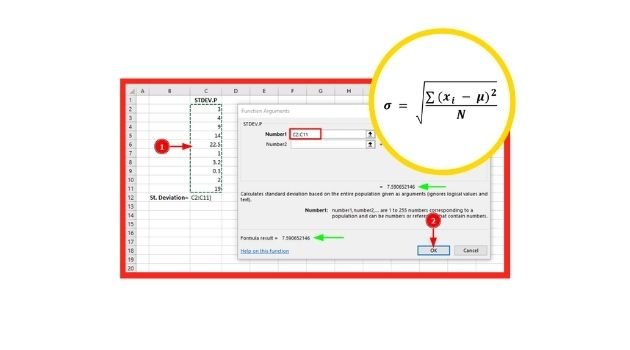
Calculate standard deviation in Excel using STDEV.S (sample) and STDEV.P (population) functions. Includes Excel formulas, step-by-step examples, when to use each function, Bessel's correction explained, and downloadable practice dataset with real examples.
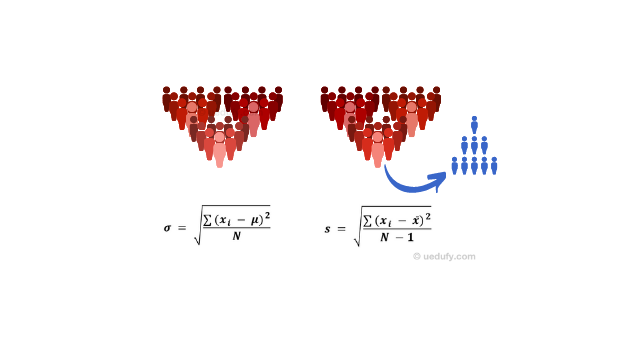
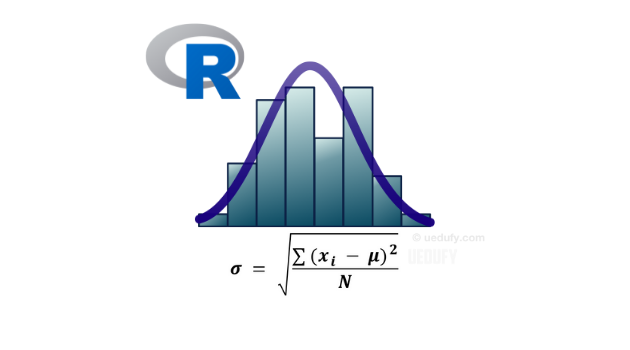
Learn the difference between population and sample standard deviation formulas with step-by-step calculations. Includes formula explanations, hand calculations, symbol definitions (σ vs s), when to use each formula, and the relationship between standard deviation and variance.
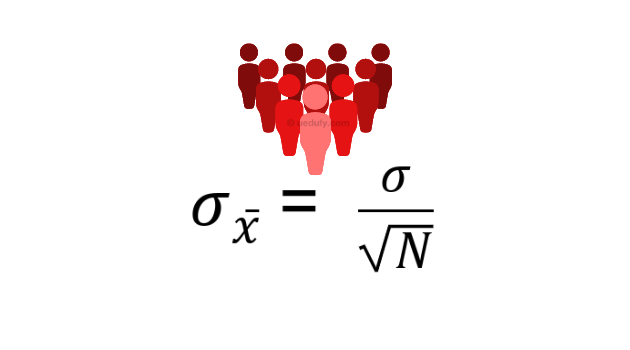
Learn how to find standard error of the mean in Excel, SPSS, and R with step-by-step tutorials. Includes standard error formula, calculation examples, interpretation guide, and downloadable datasets for practice.
![Multiple Linear Regression in SPSS: Complete Guide [2026]](/images/blog/en/featured/calculate-multiple-linear-regression-using-spss.png)
In this statistics lesson, we will learn how to calculate multiple linear regression using SPSS and interpret multiple linear regression output in SPSS. I will also provide you with an SPSS dataset for multiple linear regression analysis so you can practice everything we cover in this lesson.
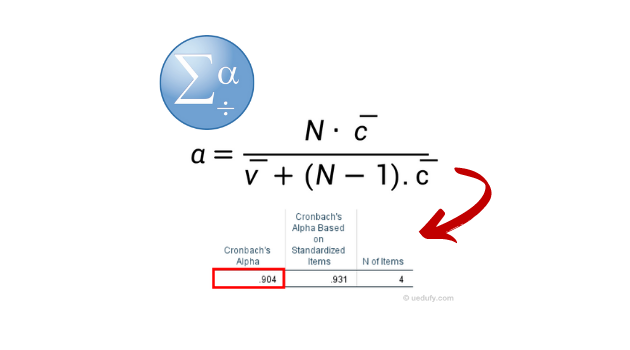
Learn how to calculate and interpret Cronbach's Alpha in SPSS with our step-by-step guide. Includes formula explanation, interpretation table, and comprehensive FAQ for reliability testing.
![How To Run Mediation Analysis in SPSS [Baron & Kenny + PROCESS Macro]](/images/blog/en/featured/how-to-run-mediation-analysis-in-spss.png)
Complete SPSS mediation analysis guide using Baron & Kenny and PROCESS Macro methods. Includes Sobel test, bootstrapping, free dataset, APA reporting template, assumptions testing, and troubleshooting common issues.
![How To Perform Moderation Analysis in SPSS [2 Methods]](/images/blog/en/featured/how-to-perform-moderation-analysis-in-spss.png)
Complete guide to moderation analysis in SPSS: manual regression method and PROCESS Macro (Model 1). Includes step-by-step instructions, interpretation guide, assumptions checklist, and effect size calculation with free dataset.
![How To Install PROCESS Macro In SPSS [PC and Mac] (2026)](/images/blog/en/featured/how-to-install-process-macro-in-spss-pc-and-mac.png)
Step-by-step guide to download and install PROCESS macro v5.0 in SPSS on Windows or macOS. Includes installation instructions, troubleshooting tips, and FAQs for mediation and moderation analysis.
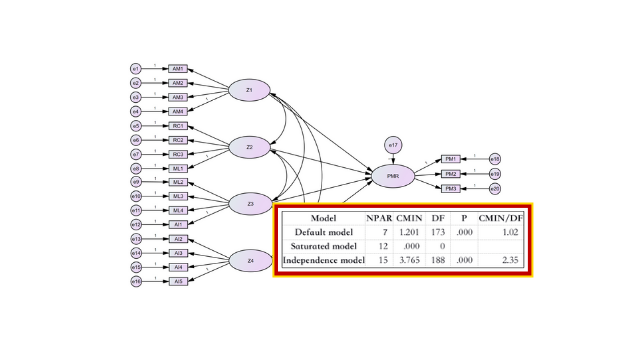
Learn how to interpret model fit results in AMOS with complete guide to AMOS model fit indices. Master CMIN/DF, RMSEA interpretation, CFI, GFI, and all fit indices with accepted cutoff values based on Hu & Bentler (1999) and academic literature.
![Moderator vs Mediator Variables: How to Tell the Difference [+ Examples]](/images/blog/en/featured/moderator-vs-mediator.png)
Learn the difference between moderator and mediator variables in research. Mediators explain HOW/WHY effects occur, while moderators show WHEN/FOR WHOM. Includes 10+ examples, statistical methods (Baron & Kenny, PROCESS macro), and step-by-step testing procedures.
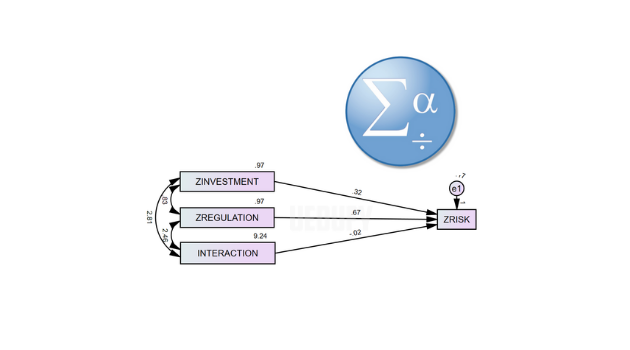
Learn how to perform moderation analysis in AMOS using step-by-step instructions with a case study. This guide covers standardizing variables in SPSS, computing interaction terms, creating models in AMOS, and interpreting moderation results with statistical significance testing.
Learn how to calculate linear regression in SPSS with step-by-step instructions. This tutorial covers regression analysis in SPSS, including interpretation of R Square, ANOVA, coefficients, and regression equation output.

Understanding independent vs dependent variables is fundamental to research design. Learn the difference between these variable types with clear examples and practical applications for your research studies.