สถิติExcel
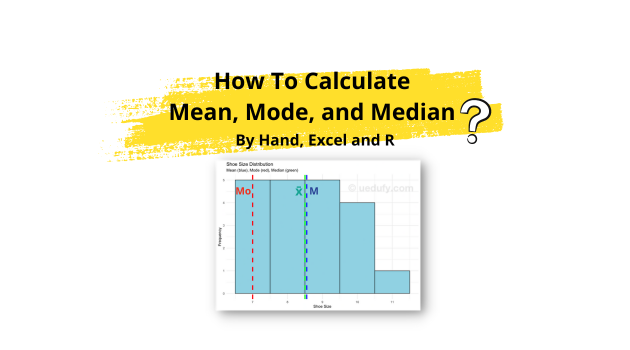
Mean Median Mode คืออะไร? วิธีคำนวณค่าเฉลี่ย ค่ามัธยฐาน ค่าฐานนิยม และความสัมพันธ์
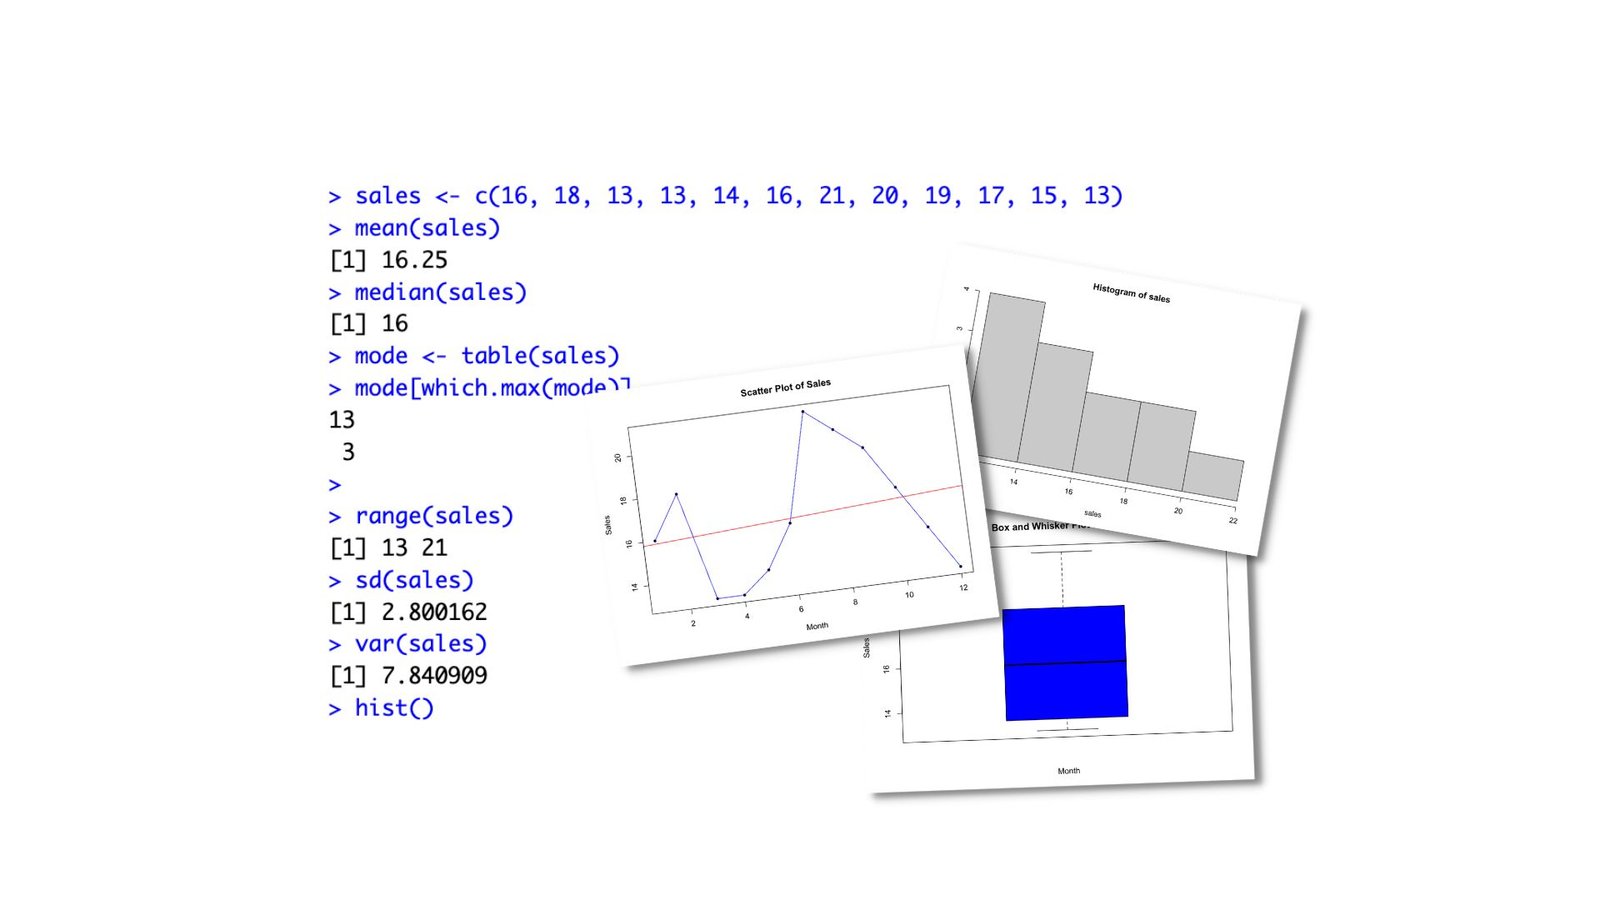
เรียนรู้วิธีคำนวณ Mean, Median และ Mode ด้วยตัวเอง ใน Excel และใน R พร้อมสูตรคำนวณ ตัวอย่างทีละขั้นตอน ความสัมพันธ์ระหว่างค่าเฉลี่ย มัธยฐาน ฐานนิยม และการประยุกต์ใช้งานจริง
By Leonard Cucos
th
![Pearson Correlation ใน Excel คืออะไร? วิธีคำนวณค่าสหสัมพันธ์ด้วยฟังก์ชัน CORREL [พร้อมตัวอย่าง]](/images/blog/th/featured/how-to-calculate-pearson-correlation-coefficient-in-excel.jpeg)


![Null Hypothesis (สมมติฐานหลัก) คืออะไร? ใช้เมื่อไหร่? [อธิบายแบบเข้าใจง่าย]](/images/blog/th/featured/null-hypothesis-explained-how-and-when-to-use-it.png)
![T-test คือ อะไร? ความหมาย ประเภททั้ง 3 และวิธีการอ่านค่า [คู่มือฉบับสมบูรณ์]](/images/blog/th/featured/ความหมาย-t-test.png)
![สูตร หาค่า T-test ใน Excel: คู่มือฉบับสมบูรณ์ทั้ง 3 ประเภท [One-Sample, Independent, Paired]](/images/blog/th/featured/t-test-in-excel-complete-guide.png)
![การวิเคราะห์ตัวแปรกำกับแบบ Multiple Moderation ใน R [ฉบับมืออาชีพ]](/images/blog/th/featured/how-to-run-multiple-moderation-analysis-in-r-like-a-pro.png)

![Moderation Analysis ใน R คืออะไร? วิธีการวิเคราะห์ตัวแปรกำกับด้วย R [Single Moderator]](/images/blog/th/featured/how-to-run-moderation-analysis-in-r-single-moderator.png)
![วิธีการวิเคราะห์ตัวแปรคั่นกลางใน R [Mediation Analysis] 7 ขั้นตอนง่ายๆ](/images/blog/th/featured/how-to-run-mediation-analysis-in-r.png)
![Measure of Central Tendency คืออะไร? ค่ากลางทางสถิติ Mean, Median, Mode [คู่มือฉบับสมบูรณ์]](/images/blog/th/featured/what-is-a-measure-of-central-tendency.png)
![วิธีปัดเศษทศนิยม: ด้วยตัวเอง Excel และ R [คู่มือฉบับสมบูรณ์]](/images/blog/th/featured/how-to-round-numbers-by-hand-excel-and-r.png)
![วิธีแปลงทศนิยมเป็นเปอร์เซ็นต์: แบบคำนวณเอง Excel และ R [คู่มือฉบับสมบูรณ์]](/images/blog/th/featured/how-to-convert-decimals-to-percentages-in-no-time.png)
![วิธีแปลงเปอร์เซ็นต์เป็นทศนิยม: Excel, แบบคำนวณเอง และ R [คู่มือฉบับสมบูรณ์]](/images/blog/th/featured/how-to-convert-percentages-to-decimals.png)
![Homoscedasticity คืออะไร? วิธีการตรวจสอบ [อธิบายแบบเข้าใจง่าย]](/images/blog/th/featured/what-is-homoscedasticity-assumption-in-statistics.png)
![วิธีการทดสอบ Homoscedasticity ใน R [2 วิธีง่ายๆ]](/images/blog/th/featured/how-to-test-homoscedasticity-in-r.png)
![Independence Assumption คืออะไร? ทำไมสำคัญ? [อธิบายแบบเข้าใจง่าย]](/images/blog/th/featured/why-independence-assumption-is-important-in-statistics.jpeg)
![Linearity (ความเป็นเส้นตรง) คืออะไร? วิธีการตรวจสอบใน SPSS [พร้อมตัวอย่าง]](/images/blog/th/featured/what-is-linearity-in-statistics.png)

![Least Squares Regression Line คืออะไร? สูตร วิธีคำนวณ และตัวอย่างการใช้งาน [Line of Best Fit]](/images/blog/th/featured/least-squares-regression-line.png)
![สถิติเชิงพรรณนาใน Excel คืออะไร? วิธีคำนวณ Mean, Median, Mode, Standard Deviation และ Variance [คู่มือฉบับสมบูรณ์]](/images/blog/th/featured/descriptive-statistics-in-excel-the-ultimate-guide.jpeg)
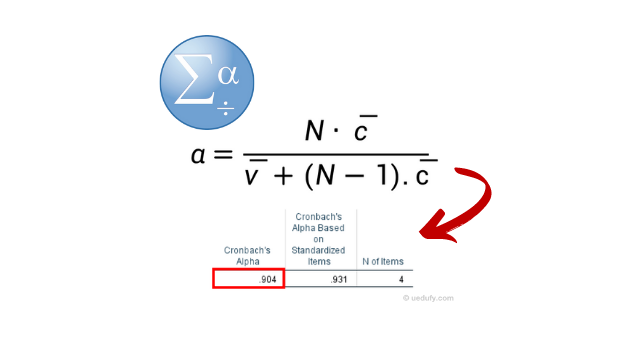
![วิธีการคำนวณค่า Cronbach's Alpha ใน Excel [ขั้นตอนพร้อมตัวอย่าง]](/images/blog/th/featured/how-to-calculate-cronbachs-alpha-in-excel.jpeg)
![ตัวอย่าง Linear Regression ใน R แบบง่ายๆ [พร้อมโค้ดและคำอธิบาย]](/images/blog/th/featured/simple-example-of-linear-regression-in-r.png)

![Data Analysis ใน Excel คืออะไร? วิธีเปิดใช้งาน Data Analysis ToolPak ใน Excel [Windows & macOS]](/images/blog/th/featured/how-to-add-data-analysis-in-excel.jpg)
![Repeated Measures ANOVA คืออะไร? วิธีการวิเคราะห์ใน SPSS [One-Way]](/images/blog/th/featured/how-to-do-one-way-anova-for-repeated-measures-in-spss.png)
![Standard Error คืออะไร? วิธีคำนวณ Standard Error ใน Excel, SPSS และ R [คู่มือฉบับสมบูรณ์]](/images/blog/th/featured/how-to-find-standard-error-of-the-mean-in-excel-spss-r.png)
![Multiple Linear Regression คืออะไร? วิธีการวิเคราะห์ Multiple Regression ใน SPSS [คู่มือฉบับสมบูรณ์]](/images/blog/th/featured/calculate-multiple-linear-regression-using-spss.png)
![ตัวแปรกำกับ คือ อะไร? วิธีการวิเคราะห์ตัวแปรกำกับใน SPSS [2 วิธี]](/images/blog/th/featured/how-to-perform-moderation-analysis-in-spss.png)
![วิธีติดตั้ง PROCESS Macro ใน SPSS [PC และ Mac]: คู่มือทีละขั้นตอน](/images/blog/th/featured/how-to-install-process-macro-in-spss-pc-and-mac.png)
![Model Fit คืออะไร? วิธีการแปลผล Model Fit ใน AMOS [พร้อมเกณฑ์ที่ยอมรับได้]](/images/blog/th/featured/how-to-interpret-model-fit-results-in-amos.png)
![ความแตกต่าง Moderator กับ Mediator คืออะไร? พร้อมตัวอย่างการวิจัยจริง [คู่มือฉบับสมบูรณ์]](/images/blog/th/featured/moderator-vs-mediator.png)
![Moderation Analysis ใน AMOS ทีละขั้นตอน [คู่มือฉบับสมบูรณ์]](/images/blog/th/featured/step-by-step-moderation-analysis-in-amos.png)
![Linear Regression คืออะไร? วิธีการวิเคราะห์ Linear Regression ใน SPSS [พร้อมตัวอย่าง]](/images/blog/th/featured/how-to-calculate-a-linear-regression-in-spss.png)
![ตัวแปรอิสระ และ ตัวแปรตาม คือ อะไร? แตกต่างกันอย่างไร? [อธิบายแบบเข้าใจง่าย]](/images/blog/th/featured/what-are-independent-and-dependent-variables.png)