What is linearity in statistics, you may ask? Have you ever looked at a scatter plot and noticed a pattern that seems to form a straight line? That's when linearity in statistics comes into play. In this article, we'll explore what linearity means, how to test for linearity, and discuss its importance in regression analysis, correlation, and other statistical methods.
The Basics: What is Linearity in Statistics?
Linearity in statistics is all about relationships. But not just any relationships – we're talking about those where a change in one variable directly corresponds to a change in another variable. Imagine a straight line connecting two points on a graph; that's a linear relationship in action: the straighter the line, the more "linear" the relationship between the variables.
A simple example of a linear relationship is the connection between the distance you travel and the time it takes to get there. If you travel at a constant speed, the relationship between distance and time will be linear, meaning that if you double the time, you'll also double the distance.
When dealing with linearity in statistics, we often represent the relationship between variables using a linear equation. In the simplest case, involving two variables (x and y), the linear relationship can be represented by the equation:
Here, represents the slope (rate of change) of the line, is the y-intercept (the value of y when ), and and are the independent and dependent variables, respectively. You can think of the slope as the "steepness" of the line, while the y-intercept is where the line crosses the y-axis.
Let's dive into an example. Suppose you want to predict the price of a pizza based on its size (in inches). You gather some data and discover that the relationship between size () and price () is linear, with a slope () of 2 and a y-intercept () of 5. Your linear equation would look like this:
Now, if you want to find out the price of a 12-inch pizza, plug in the value for :
So, a 12-inch pizza would cost $29.
Why Should We Care About Linearity?
Well, linearity is the backbone of many statistical techniques that help us understand trends, patterns, and relationships between variables. It's vital in fields like social sciences, economics, and natural sciences. Let's dive into some of the reasons why linearity is so important:
1. Regression Analysis
One of the most common uses of linearity is in regression analysis. Regression analysis is about finding a mathematical model that best fits a set of data points. When there's a linear relationship between variables, we can use a technique called linear regression to find the best-fitting line.
If we assume that there's a linear relationship between the variables, but there isn't, we might not get accurate results. We might end up with a model that doesn't describe the behavior of the variables we're interested in, or we might make predictions that are significantly off.
For example, suppose we're investigating how temperature affects plant growth. We assume that there's a linear relationship between temperature and growth, so we use linear regression to make predictions. But if the relationship between temperature and growth is nonlinear (perhaps there's an optimal temperature where growth is highest, forming a curved relationship), then our linear regression model might not be accurate. We might make predictions that don't reflect real-world outcomes.
That's why it's important to test for linearity before conducting linear regression. We need to verify that the relationship between the variables is linear before we assume that it is. If there isn't a linear relationship, we might need to transform the data or use a different model to capture the behavior of the variables accurately.
By testing for linearity in regression, we can be confident that our linear regression results accurately reflect the relationship between the variables we're interested in.
2. Correlation
Another reason to care about linearity is that it's crucial for understanding correlation. Correlation is a measure of how strongly two variables are related. When the relationship between variables is linear, the correlation coefficient (usually represented by "r" or "rho") can give us valuable insights into the strength and direction of the relationship.
A correlation coefficient of +1 indicates a perfect positive linear relationship, while a correlation coefficient of -1 signifies a perfect negative linear relationship. A correlation coefficient of 0 would indicate no linear relationship.
For instance, let's say you want to know if there's a relationship between the number of hours students study and their exam scores. By calculating the correlation coefficient, you can determine the strength and direction of the linear relationship between these two variables.
3. Analysis of Covariance (ANCOVA) and Mixed Models
While standard ANOVA doesn't require linearity assumptions (since it compares means across categorical groups), linearity becomes critical when we extend ANOVA to more complex models like ANCOVA (Analysis of Covariance) or when including continuous covariates.
In ANCOVA, we examine group differences while controlling for continuous covariates. The linearity assumption states that the relationship between the covariate and the dependent variable must be linear across all groups being compared.
For example, suppose we're comparing the test scores of three teaching methods (A, B, and C) while controlling for students' prior knowledge scores. We need to ensure that the relationship between prior knowledge and test scores is linear for all three teaching method groups.
If the relationship between the covariate and the dependent variable is nonlinear (perhaps curved or showing different patterns across groups), then ANCOVA results may be biased. The adjusted means would be incorrectly estimated, potentially leading to false conclusions about group differences.
When linearity is violated in ANCOVA, we have several options: transform the covariate to achieve linearity, use polynomial terms to model nonlinear relationships, or employ alternative analytical approaches like nonparametric methods. By verifying linearity before conducting ANCOVA, we ensure that our results accurately reflect true group differences after accounting for covariates.
4. Hypothesis Testing
In statistics, hypothesis testing is a method to determine whether two variables are related. We usually start by assuming that there's no relationship between the variables we're examining (this is called the null hypothesis). Then, we collect data and perform calculations to determine if there's enough evidence to reject the null hypothesis and conclude that there is a relationship between the variables.
However, if we assume there's a linear relationship between the variables when there isn't, we might end up rejecting the null hypothesis when we shouldn't. That's where linearity comes in. We need to verify that there's actually a linear relationship between the variables we're testing before conducting hypothesis testing.
For example, suppose we're testing whether there's a relationship between the number of hours someone exercises per week and their cholesterol levels. If there's a linear relationship between these variables, we can use hypothesis testing to determine if there's enough evidence to conclude that exercising more leads to lower cholesterol levels.
But if the relationship between exercise and cholesterol is nonlinear (perhaps curved or showing diminishing returns), then our hypothesis testing might not be accurate. We might end up rejecting the null hypothesis and concluding that there is a relationship between the variables when the relationship doesn't follow the linear pattern we assumed.
5. Design of Experiments
In statistics, experimental design helps us determine how different variables affect an outcome. For example, if we're investigating what factors affect plant growth, we might manipulate variables like light, water, and fertilizer to observe their effects on the plants.
In many experimental designs, we assume that the effect of each variable on the outcome is linear. That's where linearity comes in. We need to verify that the relationship between the variables and the outcome is linear before designing our experiment.
If we assume that there's a linear relationship between a variable and the outcome when there isn't, we might not obtain the results we're seeking. We might manipulate the variable and observe no effect on the outcome, or we might see an effect that differs from what we expected.
For example, suppose we're investigating how different levels of light affect plant growth. We assume that there's a linear relationship between light and growth, so we design our experiment to test different levels of light. But if the relationship between light and growth is nonlinear (perhaps growth plateaus after a certain threshold), then our experiment might not be accurate. We might manipulate the light and observe no additional effect on growth, or we might see a different pattern than expected.
Testing for linearity before designing an experiment is crucial. We need to verify that the effect of each variable on the outcome is linear before we assume that it is. If there isn't a linear relationship, we might need to use a different experimental design or model to capture the behavior of the variables accurately.
What Happens When Linearity is Violated?
It's crucial to verify that we have a linear relationship before using a linear regression model. If we don't, our predictions will be inaccurate, and we might not obtain the results we're seeking. Violating the linearity assumption could even lead us to identify relationships where none exist. That's why we need to test for linearity before making predictions.
If we violate the linearity assumption, we can obtain seriously biased results. For example, if we're trying to predict house prices based on square footage, we might assume we can use a linear model. But if the relationship between house prices and square footage isn't linear (perhaps prices increase exponentially as square footage increases), then our linear regression model will produce inaccurate predictions.
That's why it's essential to always test for linearity before using a linear regression model. If we don't, we might end up with biased predictions, incorrect coefficient estimates, or misleading results overall. By taking the time to verify linearity, we can ensure our models accurately reflect real-world relationships and provide valid insights into the phenomena we're investigating.
How to Test for Linearity in Statistics?
Understanding that linearity is important, how do we actually test for it? There are several methods we can use:
1. Scatterplots
A scatterplot is a graph that displays the relationship between two variables. If there's a linear relationship, the points on the scatterplot will form a pattern approximating a straight line.
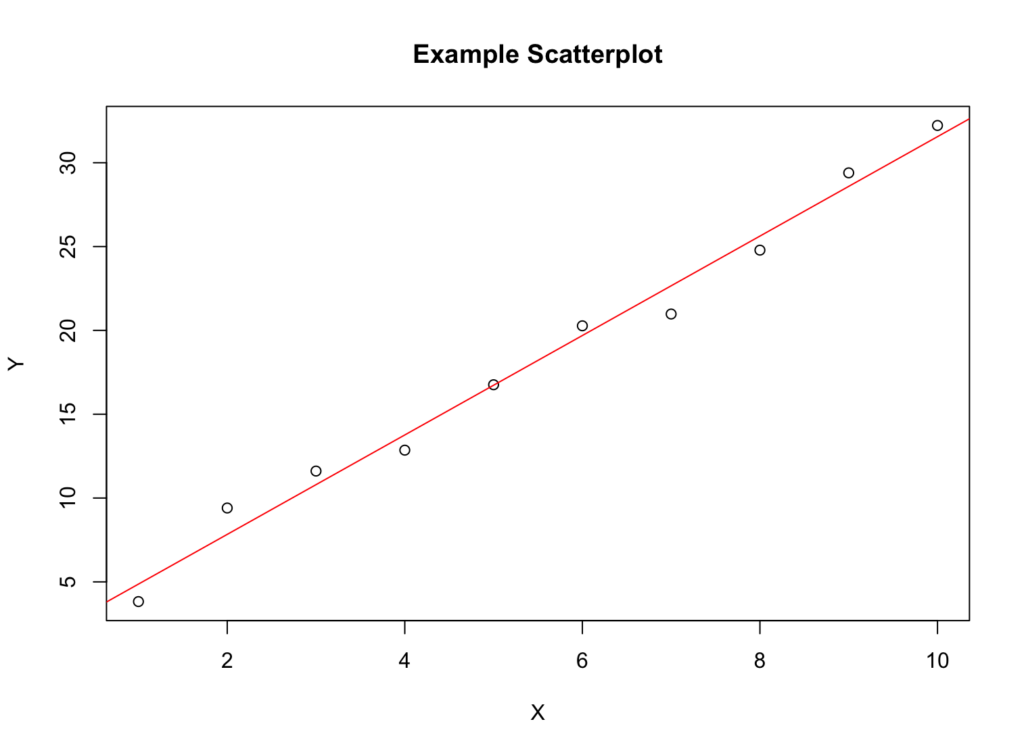 Figure 1: Scatterplot example demonstrating linear relationship
2. Correlation Coefficient
The correlation coefficient measures the strength and direction of the linear relationship between two variables. If there's a linear relationship, the correlation coefficient will be close to 1 (or -1 for a negative relationship). For example, a correlation coefficient of 0.9975 indicates a very strong positive linear relationship between variables.
3. Residual Plots
A residual plot shows the difference between observed values and predicted values from our regression model. If there's a random scatter of points with no discernible pattern, the linearity assumption is likely met. However, if there's a pattern (such as a curve or funnel shape), our linear model may not be appropriate.
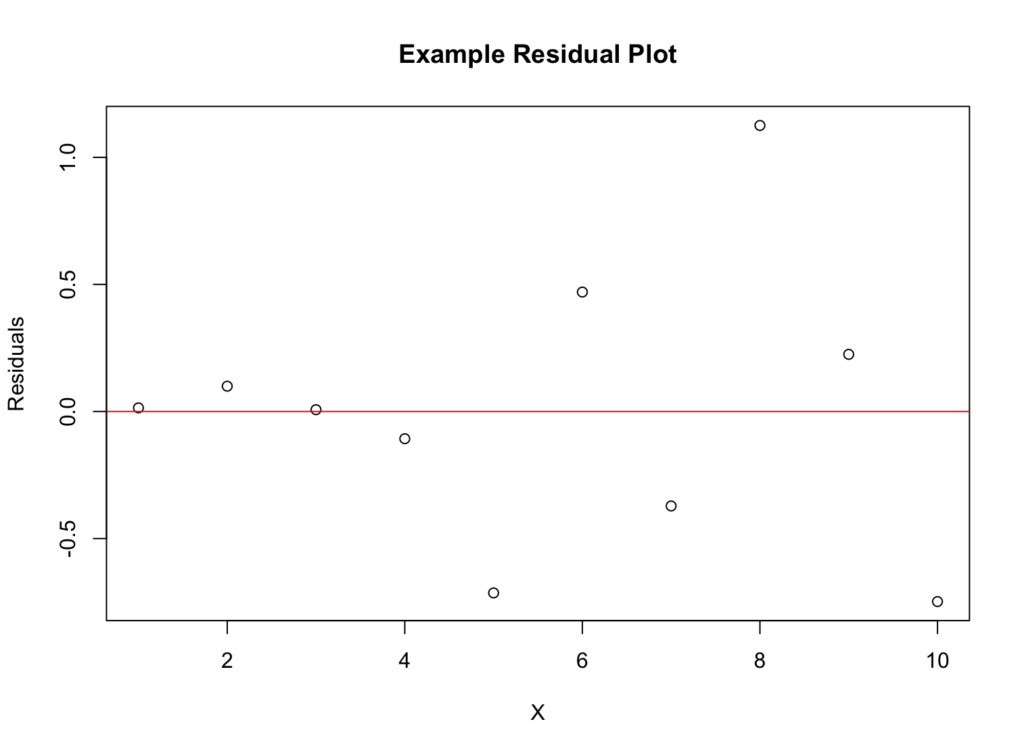 Figure 2: Residual plot for assessing linearity
By using these diagnostic methods, we can determine whether there's a linear relationship between two variables. If there is, we can use a linear regression model to make predictions. If there isn't, we'll need to either transform our data to achieve linearity or use a different modeling approach (such as polynomial regression or nonlinear models).
Frequently Asked Questions
Conclusion
In summary, linearity is a fundamental concept in statistics. Whether you're conducting linear regression analysis, performing ANCOVA, or testing hypotheses, you need to verify that there's a linear relationship between the variables you're examining.
By testing for linearity using scatterplots, correlation coefficients, and residual plots, you can avoid biased results and ensure your statistical conclusions are valid. Understanding what linearity means and how to test for linearity are essential skills for any data analyst or researcher working with quantitative data. Remember to always assess linearity assumptions before applying linear models to your data.