In the previous lesson, we learned how to find standard deviation with Excel. This time we will learn how to find the standard deviation on R step-by-step with clear examples.
Though R offers a number of data types and structures, in this tutorial we will focus on how to find standard deviation in RStudio for the most commonly used types, respectively for data frames, vectors, and arrays.
Assuming you already have R and RStudio installed on your computer, go ahead and launch RStudio. In the meantime, let's quickly overview a few important things about standard deviation – it won't take long.
Quick Reference: R Standard Deviation
| Function | Use For | Syntax | Example |
|---|---|---|---|
| sd() | Sample standard deviation | sd(x) | sd(df$column) |
| sd() | Population standard deviation | sd(x) * sqrt((n-1)/n) | sd(data) * sqrt(24/25) |
| var() | Variance (for manual calculation) | var(x) | sqrt(var(data)) |
What is Standard Deviation Anyway?
In simple terms, standard deviation tells us how spread a set of data points is relative to their average (mean) in a given dataset. A low standard deviation is preferred as it tells us the data is more reliable as it is clustered around the mean. In contrast, a high standard deviation indicates the data points are spread over a wider range of values.
The general notation for standard deviation is sd. However, standard deviation has two formulas (as well as two notations), depending on if the standard deviation is calculated for the whole population or a sample of it.
The symbol for population standard deviation is represented by the lowercase Greek letter Sigma σ while the notation for the sample standard deviation is the more-familiar letter s.
Population Standard Deviation Formula
Where:
- σ = population standard deviation
- μ = population mean
- N = population size
Sample Standard Deviation Formula
Where:
- s = sample standard deviation
- x̄ = sample mean
- n = sample size
- n-1 = Bessel's correction (degrees of freedom)
Now, that's a fair amount of confusion about standard deviation, notation, calculation, and proper use in statistical research. Lucky for you, I have the perfect fix for that! Take a few minutes and go through the Population vs. Sample Standard Deviation Explained lesson first and you'll feel confident when jumping in hot waters with R next.
Calculate Standard Deviation on R
In R, the dedicated function for standard deviation is sd() and basically calculates the square root of the variance in the input object. The object and the values it contains will be defined first and then inserted as input objects in the sd() function for computation.
Important: R's sd() function calculates the sample standard deviation (using n-1 in the denominator). If you need the population standard deviation, you'll need to apply a correction factor.
Next, let's learn how exactly we calculate the standard deviation in R using the built-in sd() function and some step-by-step examples.
Using Excel Dataset
Let's start by calculating the age standard deviation on R for a group of respondents in an Excel dataset.
You can follow along by downloading the Standard-Deviation-on-R.xlsx file from the sidebar. Once downloaded, import the Excel dataset in RStudio by navigating to File → Import Dataset → From Excel and selecting the downloaded file.
Our sample Excel dataset contains two columns: age and weight as seen in the following picture.
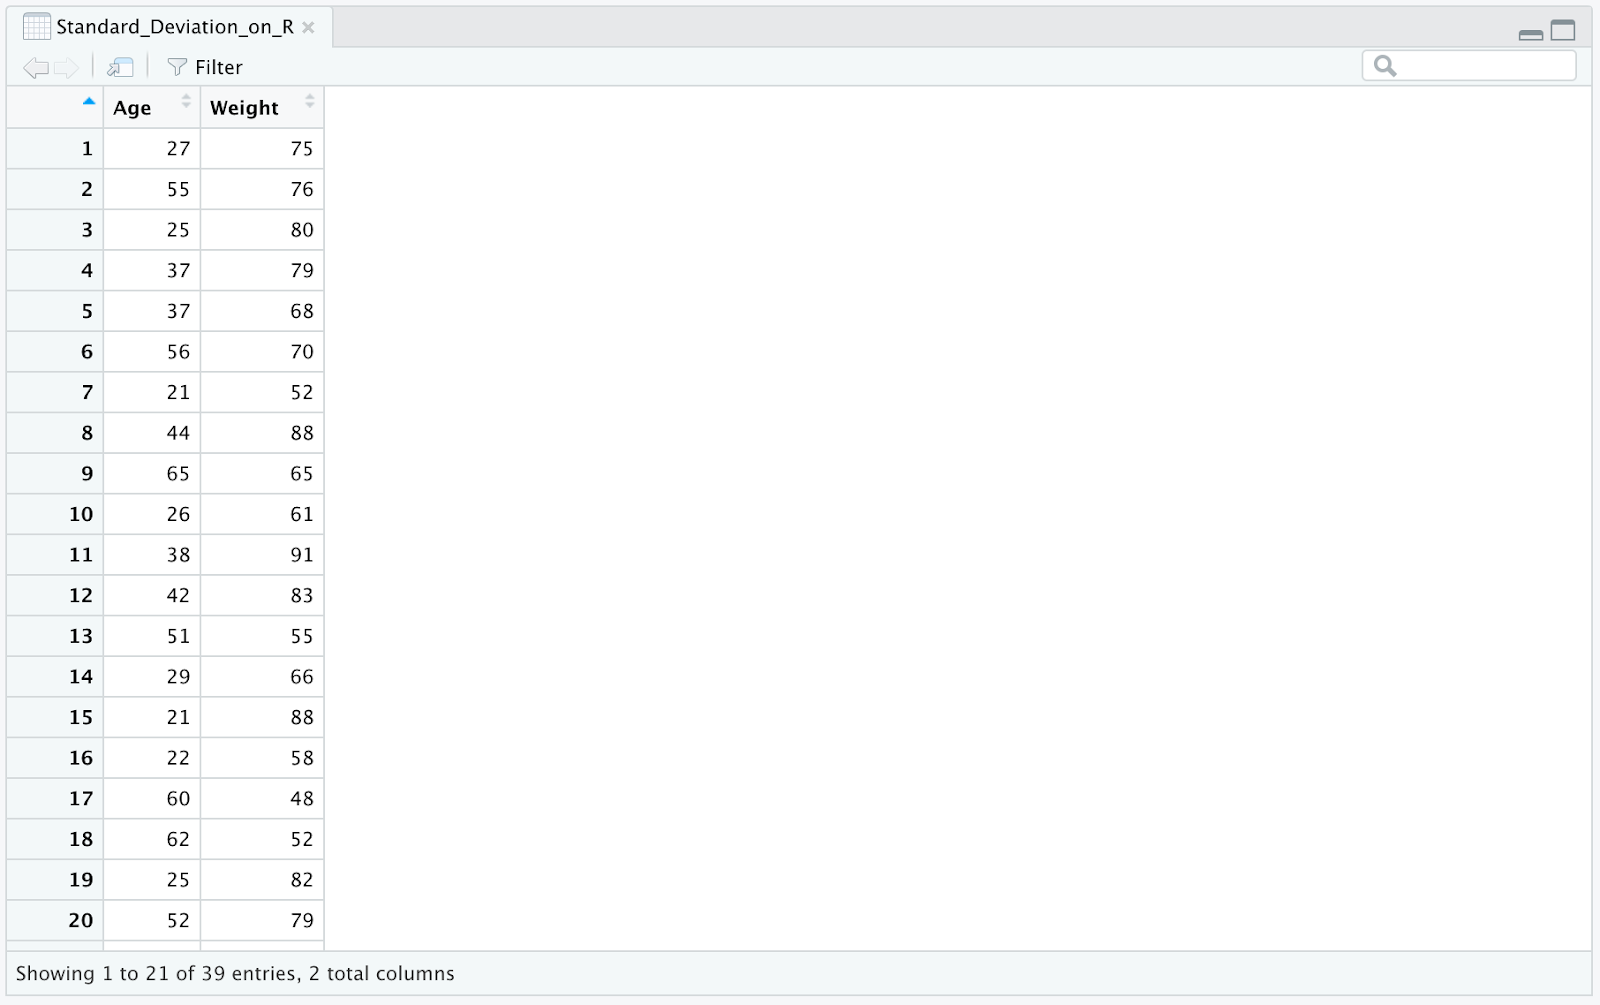 Sample Excel dataset with Age and Weight columns for standard deviation analysis in R
Step 1: Import the Excel file
In RStudio, navigate to:
- File → Import Dataset → From Excel
- Select the Standard-Deviation-on-R.xlsx file
Step 2: Calculate standard deviation for the age column
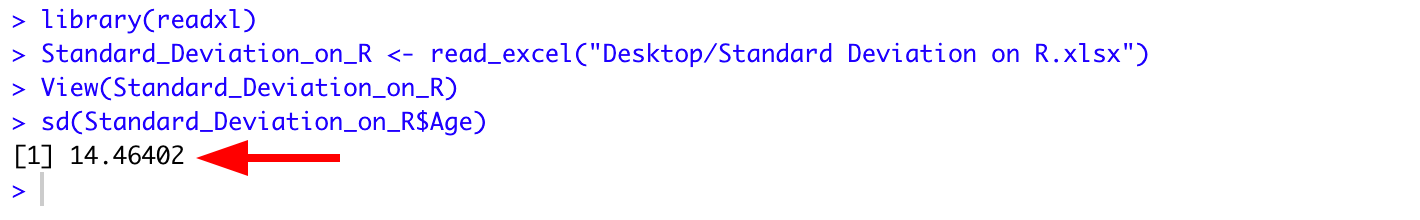
To find the standard deviation in R for the age subset in the imported Excel dataset, type in the RStudio console:
sd(Standard_Deviation_on_R$Age)Where:
- sd() = standard deviation function in R
- Standard_Deviation_on_R = Excel dataset object
- $ = operator used to extract a specific part of an object, e.g., age column
And the standard deviation for age is 14.46402. Now, go ahead and calculate the standard deviation for the weight subset in the same Excel file.
 RStudio console output displaying standard deviation of 14.46402 for the Age column
Step 3: Calculate standard deviation for the weight column
sd(Standard_Deviation_on_R$Weight)Using Data Frames
In R, data frames consist of three components: rows, columns, and data. In a nutshell, data frames are everything that can store tabular data.
We can import a data frame in R from a text or Excel file (as we did previously) or can create a manual data frame and extract the standard deviation of a numerical column from it using the sd() function in R.
First, let's create a data frame in R consisting of five top tech companies and their price per share (NASDAQ) at the moment of writing this post:
| APPL | MSFT | AMZN | GOOGL | TSLA |
|---|---|---|---|---|
| 174.24 | 308.31 | 3259.95 | 2781.35 | 1078 |
Step 1: Create the data frame
We will use the data.frame() function to create the df object in R. This data frame will have five columns and two rows, similar to the table above, containing the company ID (1 to 5), company name, and the share price for each company.
Here is how we create this data frame in R using one command:
df <- data.frame(company_id = c(1:5),
     company_name = c("APPL", "MSFT", "AMZN", "GOOGL", "TSLA"),
     share_price = c(174.24, 308.31, 3259.95, 2781.35, 1078),
     stringsAsFactors = FALSE)
Where:
- df = data frame object containing the company ID, company name, and share price of the top five US tech companies
- stringsAsFactors = an argument for the data.frame() function and is used to determine whether strings in a data frame should be regarded as factors or as ordinary strings. In this case, we want to treat data as character strings so we added the FALSE flag to the stringsAsFactors argument
Step 2: Calculate standard deviation for share_price column
Finally, let us calculate the standard deviation on R for the share price of the top five US tech companies using the now-famous sd() R function:
sd(df$share_price)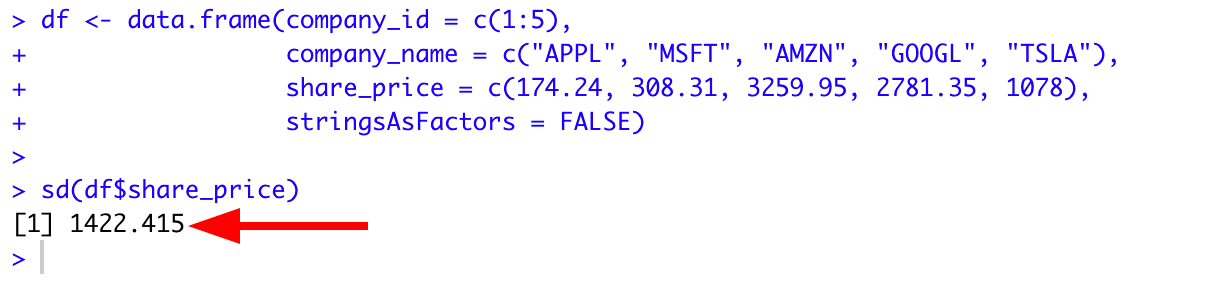 Standard deviation output of 1422.415 for tech company share prices in R data frame
As you see, the computed standard deviation for the given share price is 1422.415.
Of course, we can add additional rows and columns to a data frame and expand our analysis for standard deviation in R beyond just the share price.
Using Vectors
A vector is the most basic data structure in R and consists of a collection of data components of the same kind.
For example, in R the vector 1:10 will contain the values from 1 to 10 respectively 1, 2, 3, 4, 5, 6, 7, 8, 9, 10.
Furthermore, a vector can contain specific values as well. For instance, the vector c(2,4,6) will contain the values 2, 4, and 6.
Step 1: Create a vector
Let's start by creating a vector vc using the operator (:) and vector components containing values from 1 to 10.
vc <- 1:10Step 2: Visualize the vector (optional)
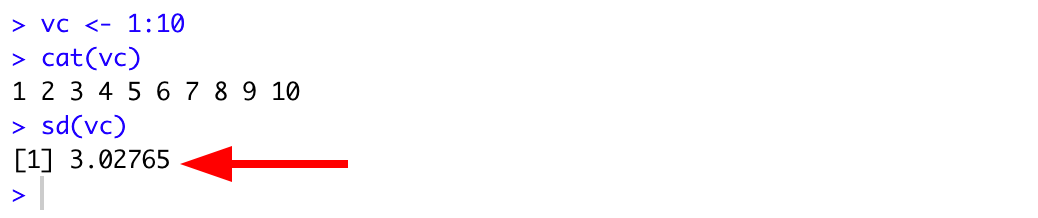
You can visualize the vc vector components using the concatenate command cat as follows:
cat(vc)Step 3: Calculate standard deviation
Next, calculate the standard deviation on R for the vc object using the command:
sd(vc)Here is the complete output. As we can see, the standard deviation in R for the vc vector is 3.02765
 Standard deviation of 3.02765 calculated for vector containing values 1 through 10 in RStudio
Using Arrays
In R, an array is a collection of objects that may carry two or more dimensions of data (multi-dimensional) and hold values that are of the same data type. Arrays should not be confused with vectors that are uni-dimensional in nature.
To find the standard deviation for an array in R, we need to create the array by using the built-in function array(). To do so, we will take two vectors as arguments (e.g., vc1 and vc2) and then set the dimensions of the matrix using the dim function.
Step 1: Create the first vector
First, let us define the vc1 vector with the elements 12 and 8 using the command:
vc1 <- c(12,8)Step 2: Create the second vector
And configure the vc2 vector consisting of 39 and 17 elements:
vc2 <- c(39,17)Step 3: Create an array from the vectors
Next, we need to create an array using the vc1 and vc2 vectors and use the dim function to set the dimensions of the matrix (columns by rows) as follows:
arr <- array(c(vc1, vc2), dim = c(2, 2))Step 4: Calculate standard deviation for the array
And finally, we can use the sd() function to calculate the standard deviation on R for the newly created array object:
sd(arr)Below is the complete output in R for the above commands. As you can see, the standard deviation for the arr array is 13.832
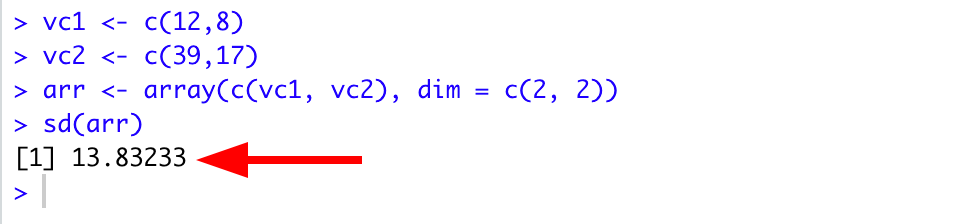 Standard deviation of 13.832 calculated for 2x2 array created from vectors in RStudio
Population vs. Sample Standard Deviation in R
As mentioned earlier, R's sd() function calculates the sample standard deviation by default (using Bessel's correction with n-1).
If you need to calculate the population standard deviation in R, you need to apply a correction factor:
# Sample standard deviation (default)
sample_sd <- sd(data)

# Population standard deviation
n <- length(data)
population_sd <- sd(data) * sqrt((n-1)/n)
Example: Population Standard Deviation
Let's calculate the population standard deviation for our vector example:
# Create vector
vc <- 1:10

# Sample standard deviation
sd(vc)  # Returns 3.02765

# Population standard deviation
n <- length(vc)
sd(vc) * sqrt((n-1)/n)  # Returns 2.872281
Frequently Asked Questions
Wrapping Up
In this R tutorial for statistics, we learned how to calculate standard deviation in RStudio for imported Excel datasets, data frames, vectors, and arrays.
Though calculating the standard deviation in SPSS or Excel can be somehow more straightforward, R gives us a lot of flexibility and control over the data we input and manipulate.
Key takeaways:
- The sd() function is R's built-in function for standard deviation
- R calculates sample standard deviation by default (using n-1)
- Use the correction factor
sd(x) * sqrt((n-1)/n)for population standard deviation - The $ operator extracts columns from data frames
- Standard deviation works with Excel imports, data frames, vectors, and arrays
I hope you found some value in this R tutorial. If so, kindly help spread the knowledge by sharing this article with your friends and colleagues.
References
Field, A., Miles, J., & Field, Z. (2012). Discovering statistics using R. SAGE Publications.