In this lesson, we will draw a comparison between the population vs. sample standard deviation formula and how to calculate the equations by hand.
The standard deviation requires us to know the average (mean) for the population or sample we measure. We will demonstrate how to calculate the mean for a set of values using step-by-step examples.
This lesson also demonstrates how to calculate variance from standard deviation using a simple mathematical relationship.
What is Standard Deviation? Definition and Explanation
Standard deviation measures how dispersed the scores in a dataset are relative to the average of the scores. In other words, standard deviation measures the spread of a group of data points relative to the mean. The more spread they are, the higher the standard deviation. Standard deviation is a fundamental component in many statistical procedures including correlation analysis and hypothesis testing.
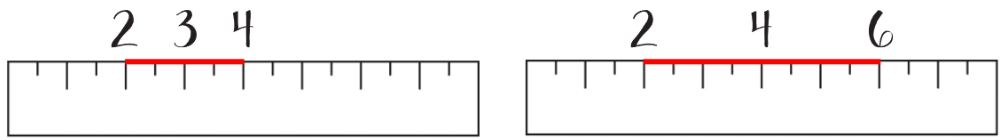
To make sure we grasp this concept, think of the following two groups of numbers:2, 3, 4 and 2, 4, 6.
Which set of numbers has a greater standard deviation?
You are right: the second group consists of the numbers 2, 4, and 6. But why? Let’s compare these groups using a number line.
 Number line comparison showing spread of values for standard deviation calculation
The standard deviation for the second group of numbers (2, 4, 6) must be higher because the values on the number line are more spread. In contrast, the numbers in the first group (2, 3, 4) are closer together; therefore, the standard deviation must be lower.
But how do we prove we are right? After all, a data set can have hundreds or even thousands of values.
Well, as you probably guessed, by using the standard deviation equation.
Before we get down to practicing our math skills, keep in mind that there are two equations for standard deviation, respectively:
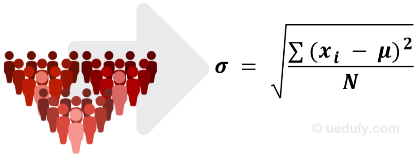
- The population standard deviation formulacalculates the standard deviation for an entire population and requires the population mean to be known.
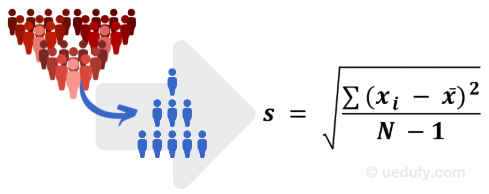
- The sample standard deviation formulais used to compute the standard deviation for a population sample and requires the sample mean to be known.
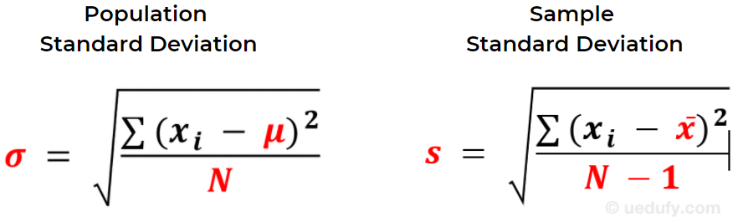
Here is a side-by-side comparison between the two formulas, with the differences highlighted in red.
 Population vs. sample standard deviation formula comparison
Population vs Sample Standard Deviation Symbols (σ vs s)
The notation differs between population and sample standard deviation formulas:
Population Standard Deviation Symbol:
- σ (lowercase Greek letter sigma) = population standard deviation
- μ (lowercase Greek letter mu) = population mean
- N = total number of values in the population
Sample Standard Deviation Symbol:
- s (lowercase letter s) = sample standard deviation
- x̄ (x-bar) = sample mean
- N-1 = sample size minus one (Bessel's correction)
Both formulas calculate standard deviation using the same fundamental approach, with key differences in notation and the denominator (N vs N-1) which we will demonstrate in detail next.
Population Standard Deviation Formula
As the name implies, the following equation is used to calculate the standard deviation for a given population.
 Population standard deviation formula
Where:
- σ = symbol for population standard deviation
- Σ = sum of the following terms
- xi = every point in the dataset (observation or member of the population)
- μ = population mean
- N = the number of values in the population
Now let’s put everything together. This is how you read the population standard deviation formula: standard deviation (σ) equals the square root of the sum of (Σ) all the squared differences between every point xiin the dataset and the population mean (μ), divided by all the values in the set (N).
Next, let’s calculate the standard deviation for the set of numbers 3, 4, and 5 using the population standard deviation formula.
Step 1: Find the mean (μ)
To find the mean of all members in a population, simply calculate the sum of all their values and then divide the sum by the number of values in the dataset. Here is the mean for the set of numbers 3, 4, and 5.
TIP: When a set of numbers is equally spaced apart, the mean will be the number in the middle. For example, for the set of numbers 2, 5, 7, 9, 12, the mean is 7.
Step 2: Calculate the standard deviation formula for the population
For the set of numbers 3, 4, and 5, every point xi = x3, x4, x5, the mean μ = 4 as calculated above, and the population N = 3 (as we have three values in the dataset). Let's input these numbers in the population standard deviation equation:
Step 3: Calculate the sum of all points
Step 4: Solve the square root
The population standard deviation for the set of numbers 3, 4, and 5 is 0.81.
PRACTICE: Using the population standard deviation formula and following the example above, calculate the standard deviation for the set of numbers 2, 4, and 6. Is the standard deviation higher or lower than 0.81?
However, there is an important issue with samples. While a population average remains the same (we always calculate the mean for ALL the members of the population), a sample can differ from one to another.
For example, if we close our eyes and take a few random samples consisting of 5 numbers from a bowl of one hundred numbers, every sample will likely contain different numbers. Therefore, the sample means will also differ between samples.
So how do we make sure the sample we take is representative of the population from where it was sampled from? Say hello to another statistical term called the standard error. We won't cover standard error since the article I linked above contains everything you need to know about it
Sample Standard Deviation Formula
But what happens when we don’t have access to the whole population but a sample of it to calculate the mean. This is often the case in social research and luckily for us, the sample standard deviation formula is not very different from the one used for the population.
 Sample standard deviation formula
Where:
- s = symbol for sample standard deviation
- Σ = sum of the following terms
- xi = every point in the dataset (observation or member of the population)
- x̄ = sample mean
- N-1 = the number of values in the sample (N) minus 1
And this is how we read the above equation: sample standard deviation (s) is equal to the square root of the sum of (Σ) the squared differences between every data point (xi) in the sample and the sample mean (x̄), divided by population N – 1.
The difference is easy to spot between population and sample standard deviation formulas. One obvious difference is the notation for the sample mean x̄ as opposed to the population mean μ. Another difference is that we divide everything toN – 1.
The math for sample standard deviation is pretty much the same, but let’s do it anyway. This time we will use the second set of values from our number line: 2, 4, and 6.
Step 1: Calculate the sample mean (x̄)
This step is pretty much the same as finding the population average in the previous example. The sample mean for the set of numbers 2, 4, and 6 is 4. Here's the proof:
Step 2: Calculate the sample standard deviation formula
Next, input the values in the sample standard deviation equation:
Step 3: Solve the square root
The sample standard deviation for the set of numbers 2, 4, and 6 is 2.
PRACTICE:
Using the sample standard deviation formula and following the example above, calculate the standard deviation for the set of numbers 2, 5, 7, 9, and 12. To make it easier for you, the mean is 7.
When to Use Population vs Sample Standard Deviation
Choosing between population and sample standard deviation depends on your dataset:
Use Population Standard Deviation (σ) when:
- You have data for every member of the population
- You are analyzing a complete, finite dataset
- You want to describe the actual variability of your entire dataset
- Example: Test scores for all students in a single classroom
Use Sample Standard Deviation (s) when:
- You are working with a subset of a larger population
- You want to estimate population parameters from sample data
- You are conducting research where collecting all population data is impractical
- Example: Survey responses from 500 people to estimate opinions of 50,000 residents
In research and statistics, sample standard deviation is far more common because accessing entire populations is rarely feasible. The N-1 denominator in the sample formula provides an unbiased estimate of the population standard deviation. For practical calculations, you can use Excel's built-in functions to compute both population and sample standard deviation automatically.
How to Calculate Variance from Standard Deviation
Standard deviation and variance are closely related measures of dispersion. While standard deviation shows how dispersed values are from the mean, variance represents the average squared distance of each point from the mean. Variance is fundamental to many statistical tests including ANOVA and regression analysis.
The standard deviation and variance relationship becomes clear when looking at how variance is calculated. If we know the standard deviation for population or sample, all we need to do is to square it to find the variance.
For example, the population standard deviation result we calculated earlier is σ = 0.81, so we can calculate the population variance from it: 0.81² = 0.6561. The variance for the set of numbers 3, 4, and 5 is 0.6561.
The same can be done to calculate the variance for the sample using the following equation:
So to find the variance for the sample we calculated earlier all we need is to square the sample standard deviation, respectively: s² = 2² = 4. For Excel implementations, refer to our guide on how to calculate the standard deviation with Excel for both population and sample.
Frequently Asked Questions About Population and Sample Standard Deviation
Wrapping Up
Understanding the distinction between population and sample standard deviation is fundamental for statistical analysis. Population standard deviation (σ) applies when analyzing complete datasets, while sample standard deviation (s) is used when working with subsets to estimate population parameters.
The key differences lie in the notation and calculation method. Population standard deviation uses μ for the mean and divides by N, while sample standard deviation uses x̄ and divides by N-1 to correct for estimation bias. This N-1 adjustment, known as Bessel's correction, ensures that sample statistics provide unbiased estimates of population parameters.
Both formulas measure variability by calculating the square root of the average squared deviations from the mean. Variance, the squared value of standard deviation, provides an alternative measure of dispersion used extensively in reliability analysis such as Cronbach's Alpha and other psychometric assessments.
References
Diez D.M., Cetinkaya-Rundel M., Barr C.D. (2019). OpenIntro: Statistics (4th Ed).
Field, A. (2018). Discovering statistics using IBM SPSS statistics (5th edition). Sage: Thousand Oaks, CA.