Mediation analysis is a statistical method that helps you understand how and why an independent variable affects a dependent variable. Instead of just testing whether X influences Y, mediation analysis explores the underlying mechanism, the mediator variable (M) that transmits the effect from X to Y.
In this complete SPSS mediation analysis tutorial, you'll learn two practical methods to perform mediation analysis in SPSS:
- Baron & Kenny Method (with Sobel test), the traditional 3-step regression approach
- PROCESS Macro Method (with bootstrapping), the modern standard recommended for research
Practice Dataset: Download our free sample dataset to follow along with every step. The dataset includes three variables: Relationship (relationship quality), Discount (personalized discounts received), and Satisfaction (customer satisfaction).
What is Mediation Analysis?
Mediation analysis (also called mediator analysis) tests whether the relationship between an independent variable (X) and a dependent variable (Y) occurs through a third variable called the mediator (M).
Think of it this way: X doesn't directly influence Y. Instead, X influences M, which then influences Y. The mediating variable serves as the mechanism or pathway through which X affects Y.
Example Research Question: "Does customer relationship quality (X) increase satisfaction (Y) because it leads to more personalized discounts (M)?"
In this example:
- Independent Variable (X): Relationship (relationship quality score)
- Mediator Variable (M): Discount (personalized discount percentage)
- Dependent Variable (Y): Satisfaction (customer satisfaction score)
Understanding Mediation Paths
Mediation analysis examines four key pathways:
Path A: Effect of X on M (Does relationship quality increase discounts?)
Path B: Effect of M on Y, controlling for X (Do discounts increase satisfaction?)
Path C: Total effect of X on Y (Overall relationship before adding mediator)
Path C': Direct effect of X on Y, controlling for M (Relationship after adding mediator)
When mediation occurs, the direct effect (C') becomes smaller than the total effect (C). If C' drops to zero and becomes non-significant, you have full mediation. If C' decreases but remains significant, you have partial mediation.
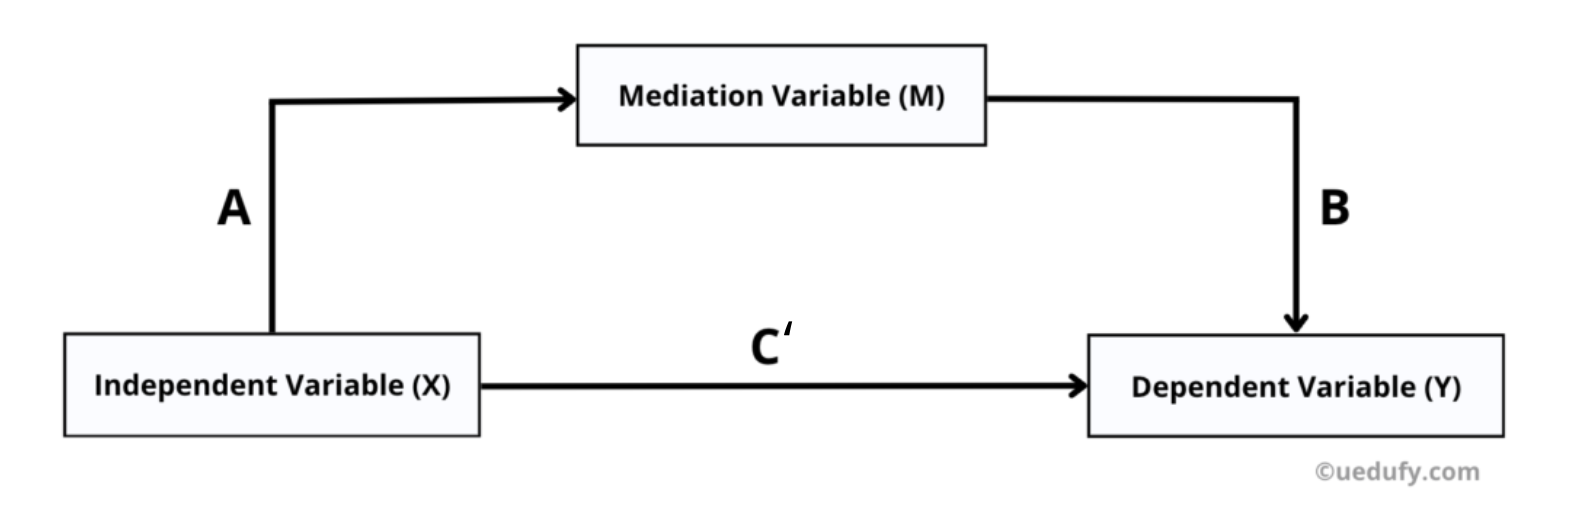
Figure 1: Conceptual diagram of mediation analysis with paths A, B, C, and C'
Method 1: Baron & Kenny Approach
The Baron & Kenny method is the traditional approach to mediation analysis, developed by researchers Baron and Kenny in 1986. This method uses three separate regression analyses to test for mediation.
Step 1: Test the Total Effect (Path C)
First, test whether X significantly predicts Y without the mediator in the model.
In SPSS:
- Go to
Analyze→Regression→Linear - Move Satisfaction (Y) to the Dependent box
- Move Relationship (X) to the Independent(s) box
- Click
OK
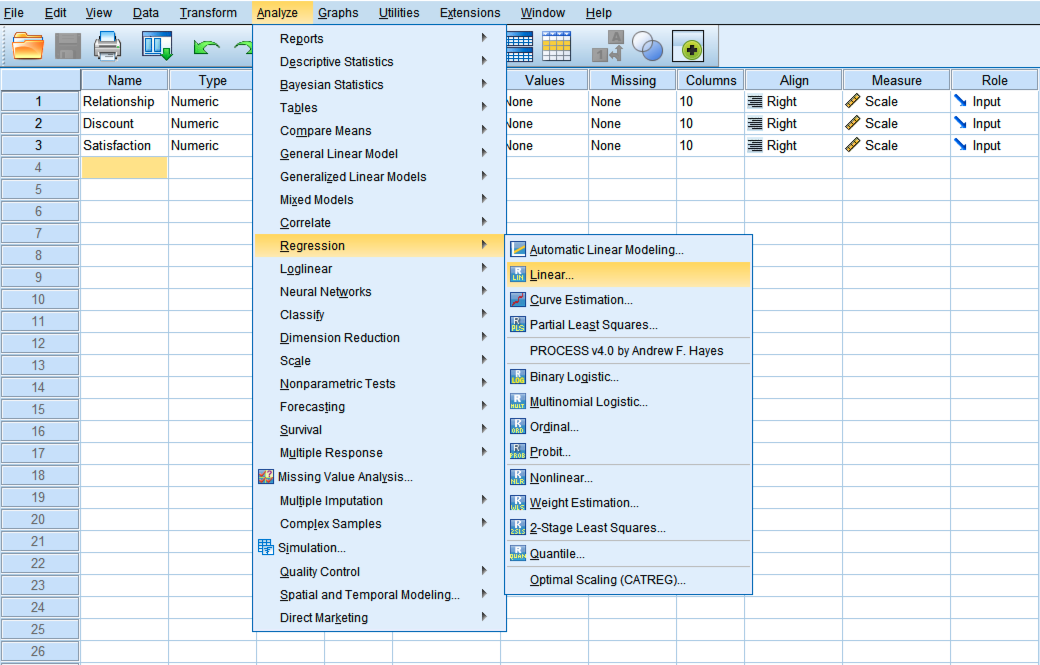
Figure 2: SPSS Linear Regression dialog for testing Path C (total effect)
What to Look For:
| Statistic | Interpretation |
|---|---|
| Beta Coefficient (β) | Size and direction of the relationship between X and Y |
| Significance (p-value) | Must be < 0.05 for mediation to be possible |
| R-squared (R²) | Proportion of variance in Y explained by X |
Table 1: Key statistics for interpreting the total effect (Path C)
If the relationship between X and Y is not significant (p > 0.05), mediation is unlikely. However, some researchers argue you can still proceed to test for indirect effects.
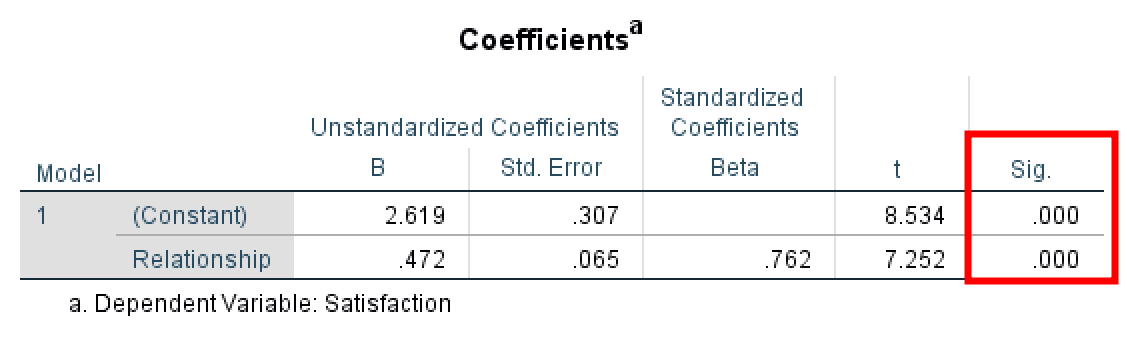
Figure 3: SPSS output showing significant total effect (Path C = 0.472, p = 0.000)
Step 2: Test Path A (X → M)
Next, test whether X significantly predicts M.
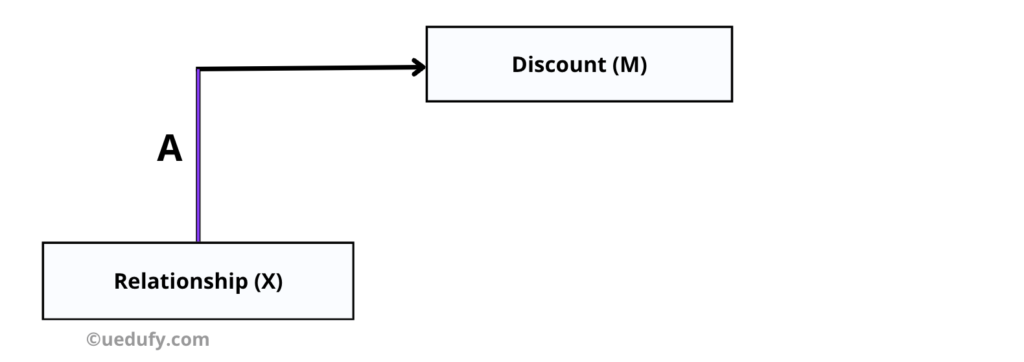
Figure 4: Diagram highlighting Path A from X (Relationship) to M (Discounts)
In SPSS:
- Go to
Analyze→Regression→Linear - Press
Resetto clear previous inputs - Move Discount (M) to the Dependent box
- Move Relationship (X) to the Independent(s) box
- Click
OK
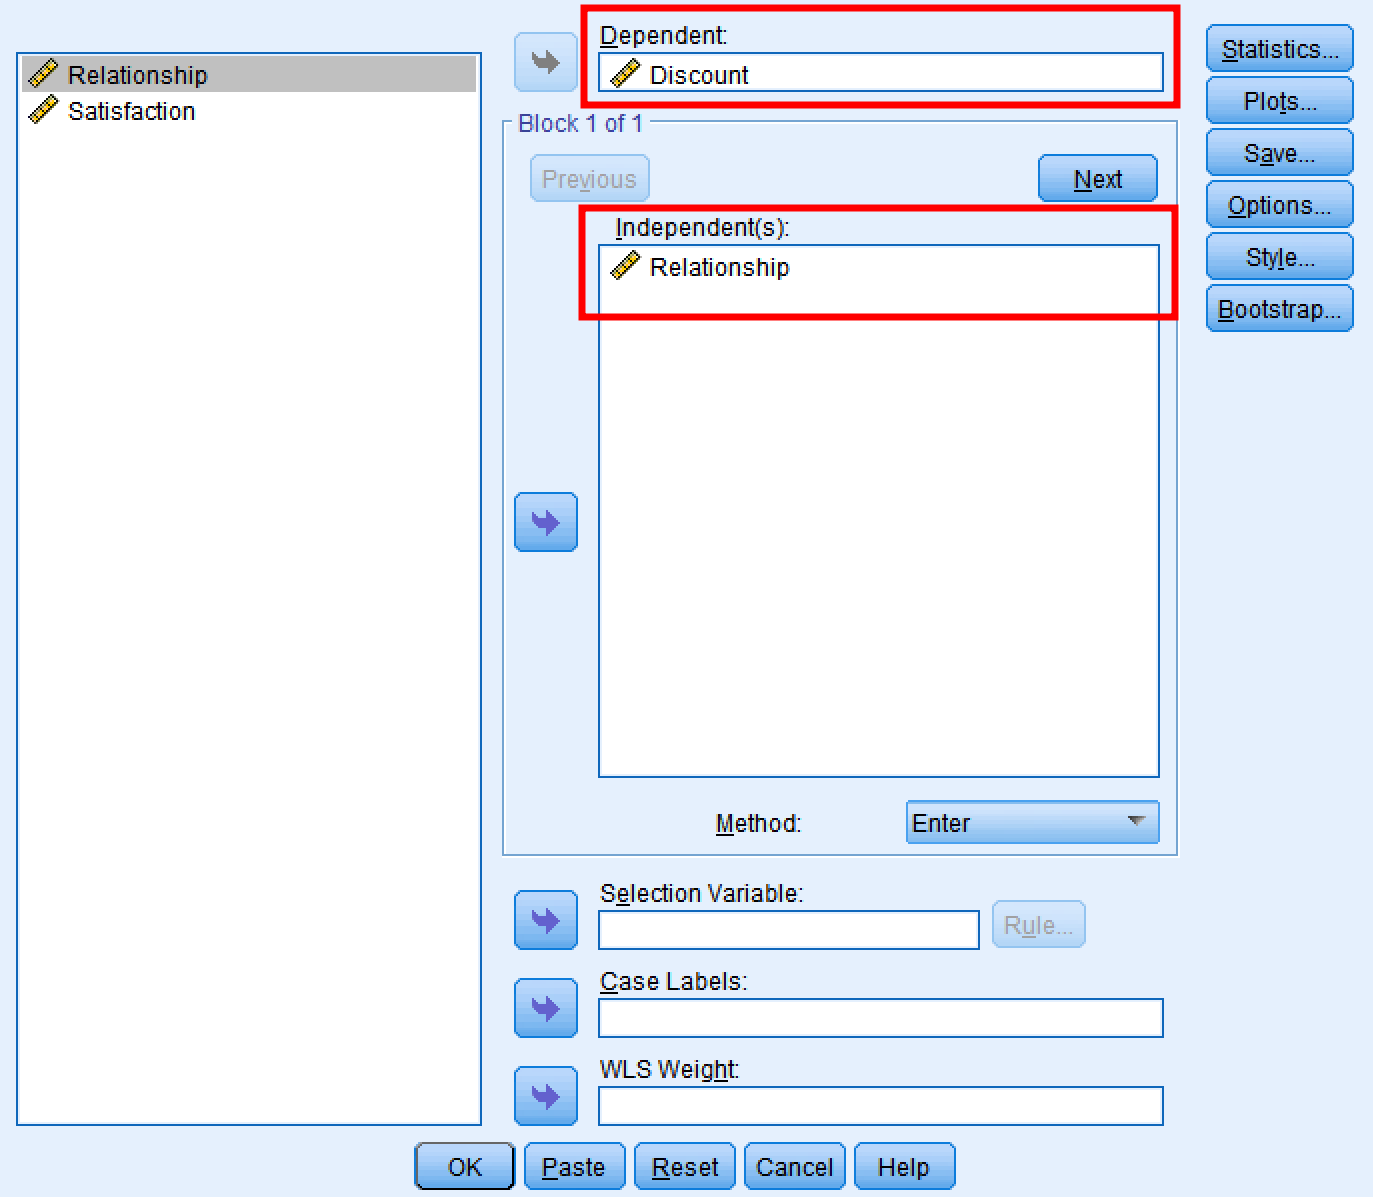
Figure 5: SPSS dialog for testing Path A (X to M)
What to Look For:
| Statistic | Interpretation |
|---|---|
| Beta Coefficient (β) | Size and direction of X's effect on M |
| Significance (p-value) | Must be < 0.05 for mediation |
| R-squared (R²) | How much X explains M |
Table 2: Key statistics for interpreting Path A (X → M)
If X does not significantly predict M, mediation cannot occur because the mediator is not influenced by the independent variable.
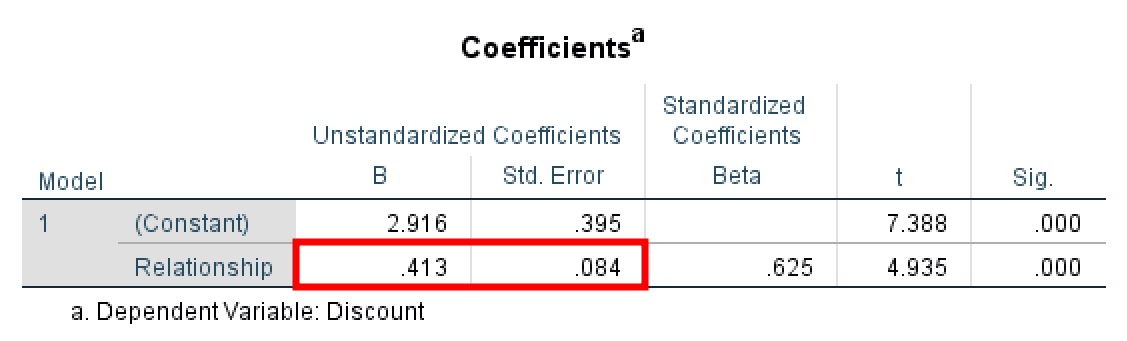
Figure 6: Path A output showing Beta = 0.413 and Std. Error = 0.084
Step 3: Test Paths B and C' (M → Y and X → Y)
Finally, test whether M predicts Y while controlling for X, and whether the direct effect of X on Y (C') has decreased.
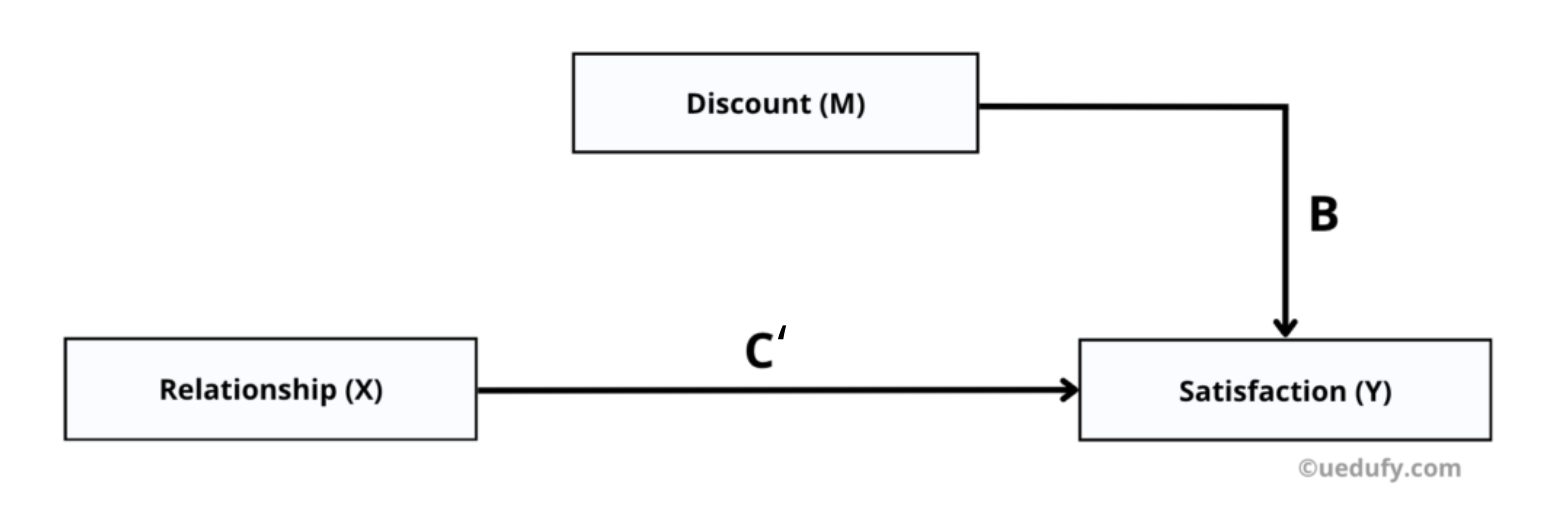
Figure 7: Direct effect model with both X and M predicting Y (Paths B and C')
In SPSS:
- Go to
Analyze→Regression→Linear - Press
Resetto clear previous inputs - Move Satisfaction (Y) to the Dependent box
- Move both Relationship (X) and Discount (M) to the Independent(s) box
- Click
OK
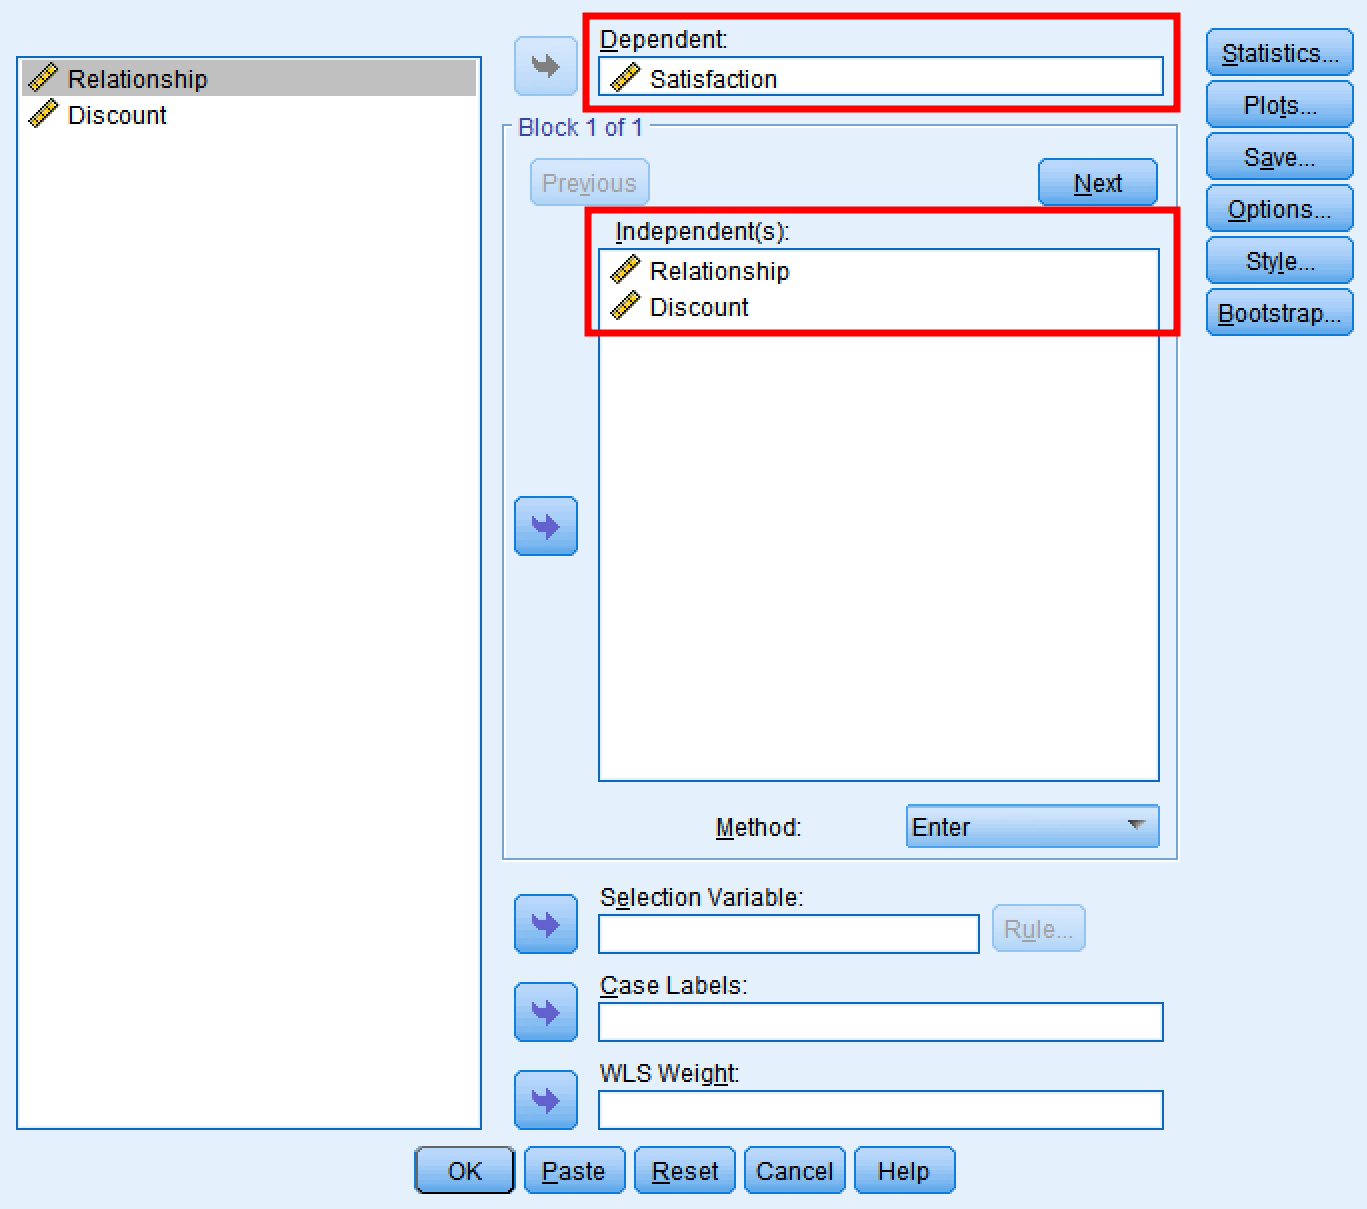
Figure 8: SPSS dialog for testing Paths B and C' with both X and M as predictors
What to Look For:
| Path | Statistic | Interpretation |
|---|---|---|
| Path B (M → Y) | Beta coefficient, p-value | M must significantly predict Y (p < 0.05) |
| Path C' (X → Y) | Beta coefficient compared to Path C | Should be smaller than Path C; if non-significant, full mediation exists |
Table 3: Key statistics for interpreting Paths B and C'
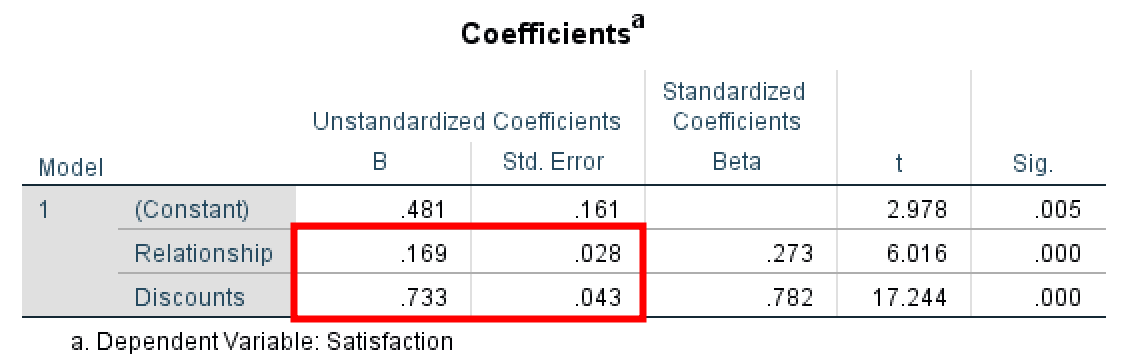
Figure 9: Path B output showing Beta = 0.733 (Discount predicting Satisfaction)
Calculating the Indirect Effect
At this point, you have all the coefficients needed to estimate the indirect effect:
Path A = 0.413 (SE = 0.084): Effect of X on M (Step 2)
Path B = 0.733 (SE = 0.043): Effect of M on Y, controlling for X (Step 3)
Path C = 0.472 (SE = 0.065): Total effect of X on Y (Step 1)
Path C' = 0.169 (SE = 0.028): Direct effect of X on Y, controlling for M (Step 3)
Key Observation: Notice that Path C' (0.169) is much smaller than Path C (0.472). This reduction shows that adding the mediator (Discount) explains a substantial portion of the X→Y relationship. The difference between these two values equals the indirect effect: 0.472 - 0.169 = 0.303.
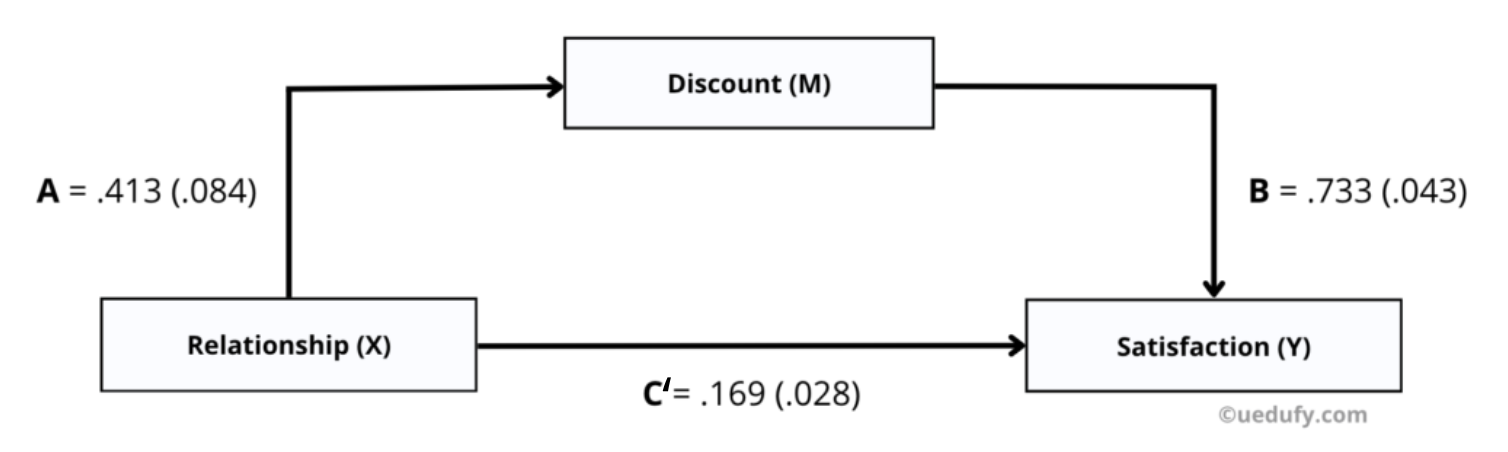
Figure 10: Summary of all mediation path coefficients (C' = 0.169 smaller than C = 0.472)
Testing Significance with Sobel Test (SPSS Mediation)
To test whether the indirect effect is statistically significant, use the Sobel Test for mediation. While SPSS does not include the Sobel test built-in, you can use our free Sobel Test Calculator.
Input the following values into the calculator and click Calculate:
- a = 0.413 (unstandardized coefficient for Path A)
- b = 0.733 (unstandardized coefficient for Path B)
- s_a = 0.084 (SE for Path A)
- s_b = 0.043 (SE for Path B)
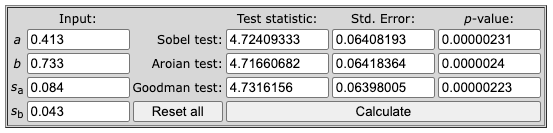
Figure 11: Sobel Test results confirming significant indirect effect (all p values less than .001)
Results (Sobel test):
- z-value = 4.7241
- Std. Error = 0.0641
- p-value < .001
All three test variants (Sobel, Aroian, Goodman) confirm significance at p < .001. The indirect effect is statistically significant.
Point Estimate of Indirect Effect:
Calculate the indirect effect by multiplying Path A × Path B:
0.413 × 0.733 = 0.303
This means the indirect effect of relationship on satisfaction through discounts is 0.303 at p < 0.001.
Interpreting Baron & Kenny Results
Full Mediation:
- Path C is significant (X → Y)
- Path A is significant (X → M)
- Path B is significant (M → Y)
- Path C' is not significant (X → Y controlling for M)
Partial Mediation:
- Path C is significant
- Path A is significant
- Path B is significant
- Path C' is still significant but smaller than Path C
No Mediation:
- One or more paths are not significant
- Path C' does not decrease meaningfully
Method 2: PROCESS Macro for SPSS Mediation Analysis (Recommended)
The PROCESS Macro for SPSS, developed by Andrew Hayes, is the modern standard for running mediation analysis in SPSS. PROCESS provides more accurate estimates of indirect effects using bootstrapping and automatically calculates confidence intervals.
Installing PROCESS Macro
Before you can use PROCESS, you need to install it in SPSS. The installation process takes about 5 minutes.
For detailed installation instructions, see our guide: How to Install PROCESS Macro in SPSS.
Running Mediation Analysis with PROCESS in SPSS
In SPSS:
- Go to
Analyze→Regression→PROCESS v5.0 by Andrew F. Hayes - Move Satisfaction (Y) to the Outcome Variable (Y) box
- Move Relationship (X) to the Independent Variable (X) box
- Move Discount (M) to the Mediator(s) (M) box
- Select Model 4 (simple mediation model)
- Check "Long variable names" if your variables have more than 8 characters
- Click
Options
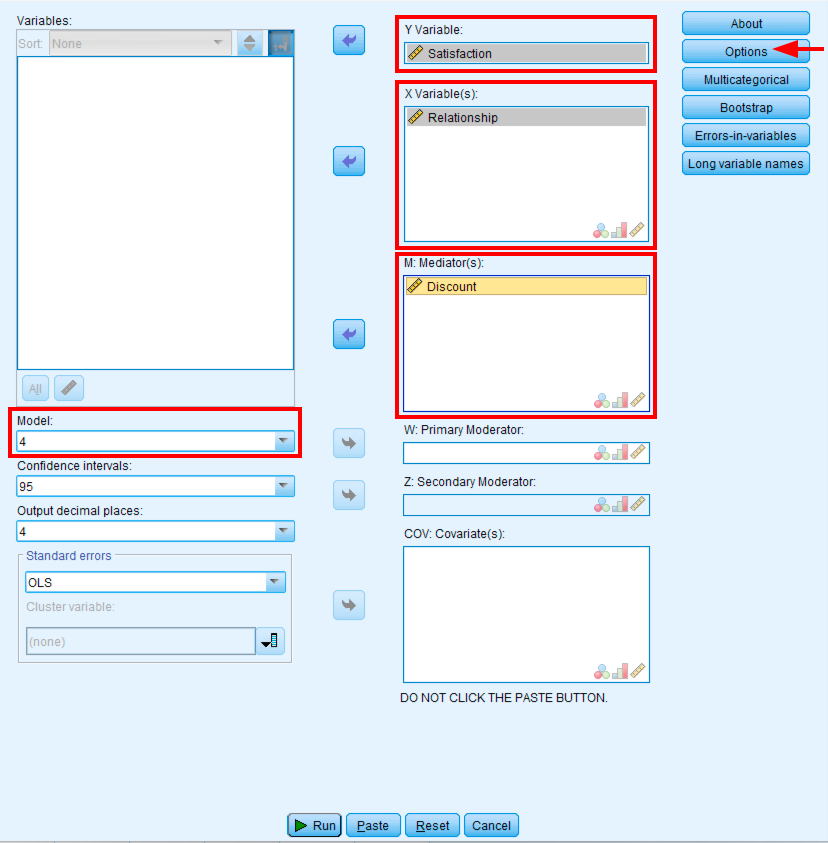
Figure 12: PROCESS Macro dialog configured for simple mediation using Model 4
In the Options window:
- Check "Show total effect model (only models 4, 6, 80, 81, 82)"
- Check "Standardized effect(s) (mediation-only models)"
- Set bootstrap samples to 5000 (default)
- Click
Continue, thenOK
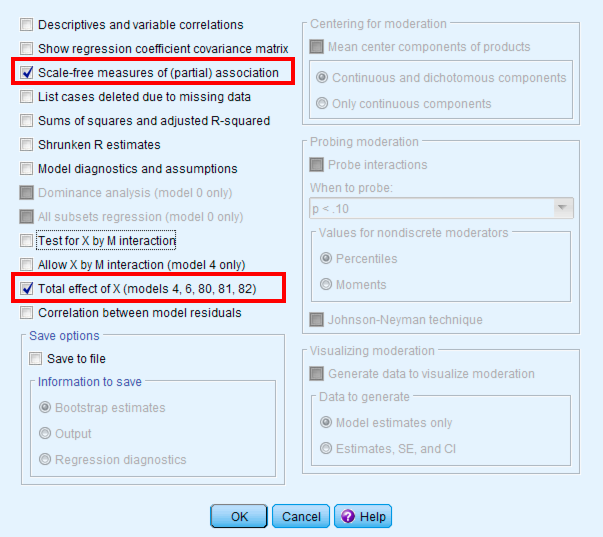
Figure 13: PROCESS options with recommended settings for mediation analysis
PROCESS will take a few seconds to run due to the bootstrap calculations.
Understanding PROCESS Output
The PROCESS output provides comprehensive results for all mediation paths and the indirect effect.
Model Summary
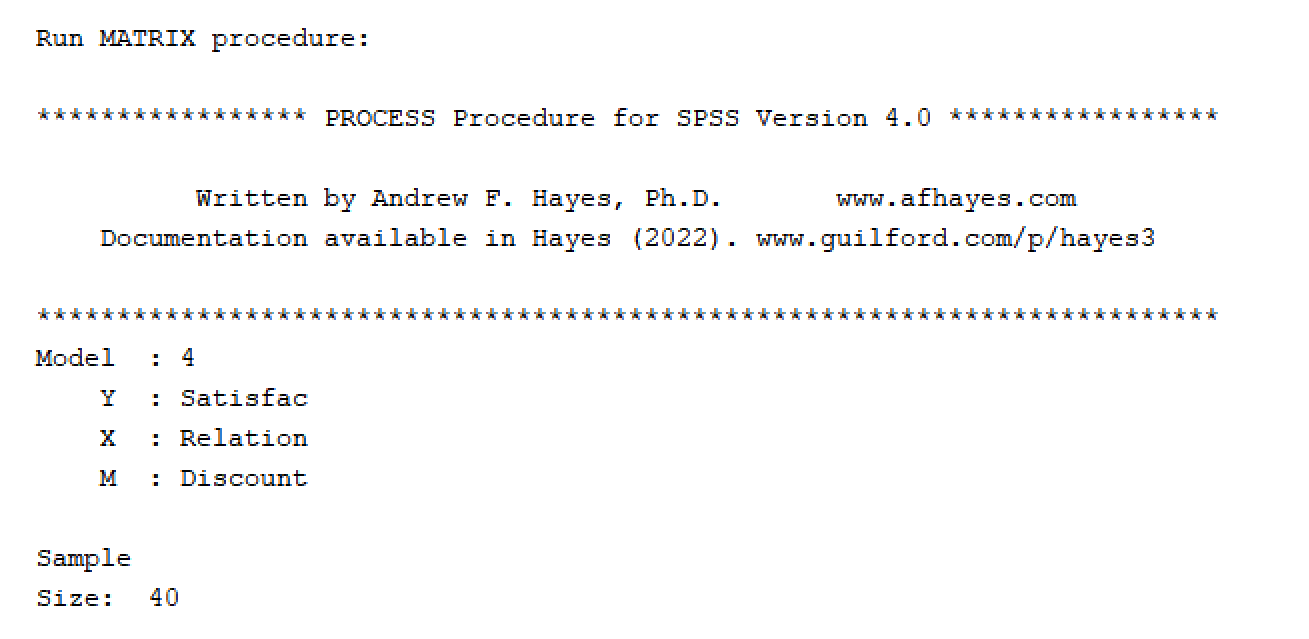
Figure 14: PROCESS output showing model overview with variable assignments
Path A: X → M
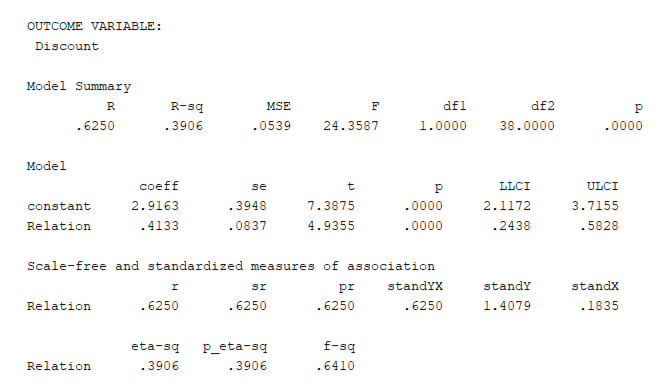
Figure 15: PROCESS Path A output showing significant effect of Relationship on Discount
The direct effect of Relationship on Discount is significant (p < 0.001).
Paths B and C': M → Y and X → Y
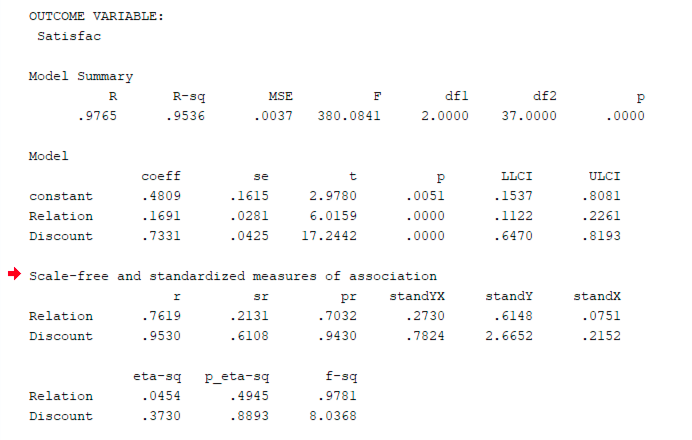
Figure 16: PROCESS output showing both predictors significantly predict Satisfaction
Both predictors (Relationship and Discount) significantly affect Satisfaction (both p < 0.001).
Indirect and Direct Effects
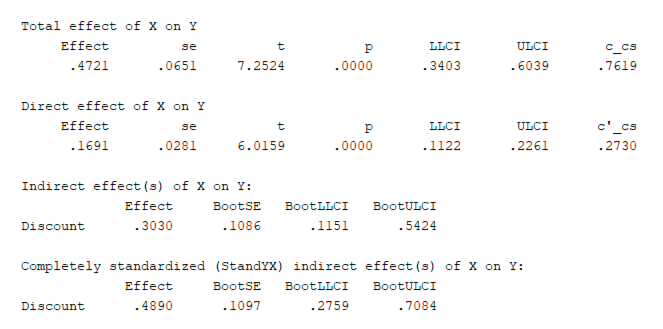
Figure 17: PROCESS indirect effect = 0.303 with bootstrap confidence interval
Key Results:
- Indirect Effect = 0.303
- Bootstrap Confidence Interval: Does NOT include zero
- Conclusion: Significant mediation exists
Interpreting PROCESS Results
Significant Mediation:
- Path a (X → M) is significant (p < 0.05)
- Path b (M → Y) is significant (p < 0.05)
- Bootstrap confidence interval for indirect effect does NOT include zero
Type of Mediation:
- Full Mediation: Path c' (direct effect) is not significant (p > 0.05) OR its confidence interval includes zero
- Partial Mediation: Path c' remains significant (p < 0.05) AND confidence interval does not include zero
The bootstrapped confidence interval is the gold standard for testing indirect effects. It's more reliable than the Sobel test because it doesn't assume normality of the sampling distribution.
Interpreting the Indirect Effect: What Does It Mean?
Finding a significant indirect effect is great, but you need to understand what the number actually tells you about your research question.
Understanding the Indirect Effect Value
In our example, the indirect effect is 0.303. Here's what this means:
Interpretation: For every 1-unit increase in Relationship, Customer Satisfaction increases by 0.30 units through the pathway of Discount. This is the portion of the total relationship that operates through the mediator.
Calculating Proportion Mediated
To understand how much of the total effect operates through the mediator, calculate the proportion mediated:
Formula: Proportion Mediated = Indirect Effect / Total Effect
In our example:
- Indirect Effect = 0.303
- Total Effect (Path C) = 0.169 + 0.303 = 0.472
- Proportion Mediated = 0.303 / 0.472 = 64.2%
What this tells you: About 64% of the relationship between Relationship and Satisfaction operates through Discount. The remaining 36% is the direct effect (customers with better relationships are more satisfied even without extra discounts).
Effect Size Guidelines
How large is an indirect effect of 0.303?
While there are no universal cutoffs, here are general guidelines based on research by Kenny (2018):
| Indirect Effect (Standardized) | Interpretation |
|---|---|
| 0.01 to 0.09 | Small effect |
| 0.09 to 0.25 | Medium effect |
| 0.25 and above | Large effect |
Table 4: Effect size guidelines for standardized indirect effects (Kenny, 2018)
In our example: An indirect effect of 0.303 represents a large effect, meaning the mediator plays a substantial role in transmitting the X→Y relationship.
Important Note: Effect size interpretation depends on your field. In experimental psychology, effects above 0.20 are considered substantial. In observational business research, effects above 0.15 are noteworthy. Always compare your effect size to similar studies in your domain.
Interpreting Negative Indirect Effects
If your indirect effect is negative, it means the mediator reverses or suppresses the X→Y relationship. This is called inconsistent mediation or suppression.
Example: If X positively predicts M (path a > 0), but M negatively predicts Y (path b < 0), the indirect effect (a × b) will be negative. This means the mediator works against the direct effect.
What If the Confidence Interval Is Very Wide?
A wide confidence interval (e.g., [0.05, 0.80]) indicates:
- High variability in your indirect effect estimate
- Small sample size (need more data for precise estimates)
- Measurement error in your variables
Solution: Increase sample size or improve measurement reliability of your variables. Mediation analysis requires adequate power. Aim for n > 200 for stable estimates.
Why Bootstrapping Mediation Analysis in SPSS Is Superior to the Sobel Test
If you're using mediation analysis for publication, understanding why bootstrapping is preferred over the Sobel test is critical. Bootstrapping mediation analysis in SPSS (via PROCESS Macro) provides more accurate and reliable results.
The Problem with the Sobel Test
The Sobel test makes a strong assumption that many researchers don't realize: it assumes the indirect effect is normally distributed.
Why this is problematic:
The indirect effect is calculated as a × b (the product of two regression coefficients). When you multiply two variables, the resulting distribution is:
- Skewed (not symmetric)
- Non-normal (especially in small samples)
- Leptokurtic (heavy-tailed)
The Sobel test uses a normal distribution to calculate the p-value. If the indirect effect distribution isn't normal (and it usually isn't), the p-value is inaccurate. This leads to:
- Lower statistical power (missing real mediation effects)
- Inflated Type II error (false negatives)
- Unreliable significance tests when n < 500
How Bootstrapping Solves This
Bootstrapping doesn't assume normality. Instead, it:
- Resamples your data 5,000 times (with replacement)
- Recalculates the indirect effect for each resample
- Builds an empirical distribution of the indirect effect from your actual data
- Calculates a confidence interval from the 2.5th and 97.5th percentiles of this distribution
Key Advantage: The bootstrap confidence interval is based on your data's actual distribution, not on theoretical assumptions about normality.
When to Use Each Method
| Method | When to Use | Sample Size Requirement |
|---|---|---|
| Sobel Test | Only for very large samples or when you can't access raw data | n > 500 (Fritz & MacKinnon, 2007) |
| Bootstrap | All research situations (recommended) | n > 50 (smaller samples acceptable) |
| Monte Carlo | When you have complex models with multiple mediators | n > 100 |
Table 5: Comparison of mediation testing methods with sample size requirements
Bottom Line: If you have raw data, always use bootstrapping. The Sobel test is outdated and only acceptable when bootstrap methods aren't available.
How Many Bootstrap Samples?
PROCESS defaults to 5,000 bootstrap samples. Is this enough?
| Bootstrap Samples | Accuracy | Recommendation |
|---|---|---|
| 1,000 | Acceptable | Minimum for exploratory analysis |
| 5,000 | Good | Standard for most research (PROCESS default) |
| 10,000 | Excellent | Best for publication in top journals |
Table 6: Bootstrap sample size recommendations for mediation analysis
Recommendation: Use 5,000 for most research. Increase to 10,000 if you have a small sample (n < 100) or if you're submitting to a top-tier journal.
Computational Note: More bootstrap samples = longer computation time. On modern computers, 5,000 samples takes 5-10 seconds, while 10,000 takes 10-20 seconds. This small time investment is worth it for more accurate results.
Comparing the Two Methods
| Feature | Baron & Kenny | PROCESS Macro |
|---|---|---|
| Ease of Use | Requires 3 separate regressions | Single command |
| Indirect Effect Test | Sobel test (assumes normality) | Bootstrap CI (no assumptions) |
| Statistical Power | Lower | Higher |
| Modern Standard | Outdated | Current best practice |
| Confidence Intervals | Not provided | Bootstrap CI provided |
| Recommendation | Use for learning | Use for research |
Table 7: Comparison of Baron & Kenny and PROCESS Macro approaches for mediation analysis
Both methods produced similar results in our example:
- Baron & Kenny: Indirect effect = 0.303 (Sobel test)
- PROCESS: Indirect effect = 0.303 (Bootstrap CI)
Reporting Mediation Results
When reporting mediation analysis in your dissertation or research paper, include:
- Descriptive statistics for all variables (means, SDs, correlations)
- Path coefficients for a, b, c, and c'
- Significance levels for each path
- Indirect effect size with 95% confidence interval
- Type of mediation (full or partial)
- Visual diagram showing the mediation model with coefficients
Example Results Statement:
"Mediation analysis using PROCESS Model 4 (5,000 bootstrap samples) revealed that Discount (M) significantly mediated the relationship between Relationship (X) and Satisfaction (Y). The indirect effect was significant, ab = 0.30, 95% CI [0.12, 0.54]. The direct effect of Relationship on Satisfaction remained significant when controlling for Discount (c' = 0.17, p < .001), indicating partial mediation. Relationship significantly predicted Discount (a = 0.41, p < .001), and Discount significantly predicted Satisfaction (b = 0.73, p < .001)."
APA-Style Mediation Results Table
Use this template to report your mediation results in APA format. Replace the values with your actual coefficients:
| Path | Coefficient | SE | t | p | 95% CI |
|---|---|---|---|---|---|
| Total effect (c) | 0.47 | 0.07 | 7.25 | < .001 | [0.34, 0.60] |
| Direct effect (c') | 0.17 | 0.03 | 6.02 | < .001 | [0.11, 0.23] |
| Path a (X → M) | 0.41 | 0.08 | 4.94 | < .001 | [0.24, 0.58] |
| Path b (M → Y) | 0.73 | 0.04 | 17.24 | < .001 | [0.65, 0.82] |
| Indirect effect (ab) | 0.30 | 0.11* | — | — | [0.12, 0.54] |
Table 8: APA-style mediation results for Relationship (X) → Discount (M) → Satisfaction (Y)
Table Caption: "Mediation analysis results showing the effect of Relationship Quality (X) on Customer Satisfaction (Y) through Personalized Discounts (M)."
Copy-Paste Version for Microsoft Word:
Copy the text below and paste it into Word. Then use Table, Convert, Text to Table to create a formatted table.
Path                    Coefficient    SE      t       p         95% CI
Total effect (c)        0.47          0.07    7.25    < .001    [0.34, 0.60]
Direct effect (c')      0.17          0.03    6.02    < .001    [0.11, 0.23]
Path a (X → M)          0.41          0.08    4.94    < .001    [0.24, 0.58]
Path b (M → Y)          0.73          0.04    17.24   < .001    [0.65, 0.82]
Indirect effect (ab)    0.30          0.11    —       —         [0.12, 0.54]

Note. N = 40. Bootstrap samples = 5,000. SE for indirect effect is bootstrap standard error.
Important Considerations
Correlation vs. Causation: Mediation analysis is correlational. Even if you find significant mediation, you cannot claim causation unless you're using experimental data with random assignment.
Sample Size: Mediation analysis requires adequate sample size. Aim for at least 200 participants for stable estimates, though smaller samples (n > 100) can work with strong effects.
Multiple Mediators: You can test multiple mediators simultaneously using PROCESS. This helps you understand which mechanisms are most important.
Mediation Analysis Assumptions
Like all statistical methods, mediation analysis relies on several key assumptions. Violating these assumptions can lead to biased estimates of the indirect effect.
1. Linearity
Assumption: The relationships between X→M, M→Y, and X→Y must be linear.
How to Test: Create scatterplots for each relationship. Look for curvilinear patterns. If relationships are curved, consider:
- Transforming variables (log, square root, or polynomial terms)
- Using nonlinear mediation models (available in R packages like
mediation)
What Happens If Violated: The indirect effect will be underestimated if the true relationship is curvilinear.
2. No Unmeasured Confounding
Assumption: There are no omitted variables that affect both M and Y (or both X and M).
How to Test: This assumption cannot be tested statistically. You must rely on:
- Theoretical knowledge of your research domain
- Including control variables that might confound the relationships
- Sensitivity analysis to assess how robust your results are to potential confounders
What Happens If Violated: The indirect effect estimate will be biased. If an unmeasured variable causes both M and Y, you may find spurious mediation.
3. Temporal Precedence
Assumption: X must occur before M, and M must occur before Y.
How to Ensure: Use:
- Longitudinal data (measure X at Time 1, M at Time 2, Y at Time 3)
- Experimental designs with random assignment to X
- Cross-sectional data with strong theory (only when longitudinal data isn't feasible)
What Happens If Violated: You cannot make causal claims. Cross-sectional mediation can only show statistical patterns, not causal mechanisms.
4. No Measurement Error
Assumption: X, M, and Y are measured without error (or measurement error is minimal).
How to Test: Calculate reliability (Cronbach's alpha for scales). Aim for α > 0.70.
What Happens If Violated: Measurement error in M biases the indirect effect downward (attenuation bias). This means you're more likely to miss real mediation effects.
Solution: Use latent variable mediation (structural equation modeling) which corrects for measurement error.
5. Independence of Observations
Assumption: Each participant's data is independent (no clustering or nesting).
What Happens If Violated: If participants are nested (e.g., students within schools), standard errors will be too small, leading to inflated significance.
Solution: Use multilevel mediation models if data is clustered.
6. No X × M Interaction
Assumption: The effect of M on Y does not depend on the level of X.
How to Test: Add an X × M interaction term to your regression model predicting Y. If significant, you have moderated mediation, not simple mediation.
What Happens If Violated: The indirect effect varies across levels of X. You need to use PROCESS Model 7, 8, or 14 (moderated mediation models).
Mediation vs. Moderation: Don't confuse mediation with moderation. In mediation, M transmits the effect of X on Y. In moderation, M changes the strength of the X-Y relationship. Learn more: Moderator vs Mediator.
Troubleshooting Common Issues
"PROCESS command not found" Error
Problem: When you run PROCESS, SPSS says the command doesn't exist.
Solutions:
- Verify installation: Go to
Analyze→Regressionand check ifPROCESS v5.0 by Andrew F. Hayesappears in the menu - Reinstall PROCESS: Download the latest version from processmacro.org and follow installation instructions
- Check syntax: If running PROCESS via syntax, ensure you're using the correct command format for v5.0 (syntax changed from v4.x)
- Restart SPSS: Sometimes SPSS needs a restart after installation for PROCESS to appear
Bootstrap Confidence Interval Includes Zero
Problem: Your indirect effect is not significant because the bootstrap CI includes zero (e.g., [-0.05, 0.23]).
What This Means: There is insufficient evidence for mediation. The indirect effect could plausibly be zero.
Solutions:
- Check your theory: Is mediation theoretically plausible? Perhaps moderation or a different mechanism is at work
- Increase sample size: Small samples (n < 100) have low power to detect mediation. Aim for n > 200
- Improve measurement: Low reliability (Cronbach's α < 0.70) attenuates mediation effects. Use validated scales
- Check for suppression: Look at the signs of Path a and Path b. If they have opposite signs, you may have inconsistent mediation
All Paths Significant But Indirect Effect Is Not
Problem: Path a is significant, Path b is significant, but the bootstrap CI for ab includes zero.
Why This Happens: The product a × b can be non-significant even when both paths are individually significant. This occurs when:
- Effect sizes are small: Both paths are weak (e.g., a = 0.15, b = 0.18), making the product even smaller (ab = 0.027)
- High variability: One or both paths have large standard errors
- Sample size is insufficient: You need more data to detect the indirect effect
Solutions:
- Increase bootstrap samples: Try 10,000 samples for more precise CI estimation
- Check for measurement error: Unreliable variables attenuate indirect effects
- Increase sample size: This is often the primary issue. Aim for n > 200
PROCESS Takes Too Long to Run
Problem: PROCESS is running for several minutes or appears frozen.
Causes:
- Too many bootstrap samples: If you set bootstrap > 50,000, it will take a long time
- Large dataset: PROCESS slows down with very large datasets (n > 10,000)
- Complex model: Models with multiple mediators/moderators take longer
Solutions:
- Reduce bootstrap samples: 5,000 is sufficient for most research. Only use 10,000 for publication
- Use a random sample: If n > 5,000, analyze a random subset (n = 1,000-2,000) to test your model first
- Check for infinite loops: If PROCESS is truly frozen (> 10 minutes), force-quit and restart SPSS
Indirect Effect Is Negative But I Expected Positive
Problem: Your theoretical model predicted positive mediation, but you got a negative indirect effect.
What This Means: You have inconsistent mediation (suppression). The mediator works against the direct effect rather than transmitting it.
Possible Explanations:
- Theory was wrong: Your hypothesized mechanism isn't correct
- Opposite signs: Check if Path a and Path b have opposite signs (one positive, one negative)
- Third variable: An unmeasured confounder may be creating spurious relationships
Next Steps:
- Report it honestly: Negative indirect effects are scientifically valid findings
- Revise your theory: Explain why the mediator suppresses rather than transmits the effect
- Explore alternatives: Consider whether you're measuring the right mediator
Direct Effect Becomes Stronger After Adding Mediator
Problem: Path c' (direct effect) is larger than Path c (total effect).
What This Means: You have suppression. The mediator was masking the true direct relationship.
Interpretation: This is a legitimate finding. It means X has two opposing effects on Y:
- A positive direct effect (c')
- A negative indirect effect through M (suppressing the direct effect)
When you control for M, you remove the suppression, revealing the true direct effect.
Example: Higher education (X) might directly increase income (Y), but it also increases student debt (M), which decreases income. When you control for debt, the true positive effect of education becomes visible.
Missing Values Cause Different Sample Sizes Across Paths
Problem: Path a uses n = 150, but Path b uses n = 145 because of missing data.
Solution: Use listwise deletion in SPSS:
- Before running PROCESS, go to
Data→Select Cases→If condition is satisfied - Enter:
NOT MISSING(X) AND NOT MISSING(M) AND NOT MISSING(Y) - Click
OK
This ensures all paths use the same participants. Alternatively, use multiple imputation to handle missing data before mediation analysis.
Frequently Asked Questions
Wrapping Up
You've learned two methods for running mediation analysis in SPSS:
- Baron & Kenny Approach: Classic 3-step method using separate regressions (good for learning the logic)
- PROCESS Macro: Modern method with bootstrapped confidence intervals (best for actual research)
For your dissertation or research project, we recommend PROCESS Model 4 because it provides more accurate and defensible results through bootstrapping.
Remember: mediation analysis reveals mechanisms, but it doesn't prove causation. Always interpret your results within the context of your research design and theoretical framework.
Next Steps:
- Run descriptive statistics in SPSS as a preliminary step to screen your variables for outliers and normality issues
- Download our practice dataset (available in the sidebar) and run both methods yourself to reinforce your learning
- Learn moderation analysis to test when relationships occur: How to Perform Moderation Analysis in SPSS
- Explore advanced techniques: How to Run Mediation Analysis in R
References
Baron, R. M., & Kenny, D. A. (1986). The moderator-mediator variable distinction in social psychological research: Conceptual, strategic, and statistical considerations. Journal of Personality and Social Psychology, 51(6), 1173-1182.
Fritz, M. S., & MacKinnon, D. P. (2007). Required sample size to detect the mediated effect. Psychological Science, 18(3), 233-239.
Hayes, A. F. (2009). Beyond Baron and Kenny: Statistical mediation analysis in the new millennium. Communication Monographs, 76(4), 408-420.
Hayes, A. F. (2022). Introduction to mediation, moderation, and conditional process analysis: A regression-based approach (3rd ed.). New York: Guilford Press.
Kenny, D. A. (2018). Mediation. Retrieved from http://davidakenny.net/cm/mediate.htm
Shrout, P. E., & Bolger, N. (2002). Mediation in experimental and nonexperimental studies: New procedures and recommendations. Psychological Methods, 7(4), 422-445.
Sobel, M. E. (1982). Asymptotic intervals for indirect effects in structural equations models. In S. Leinhart (Ed.), Sociological methodology 1982 (pp. 290-312). San Francisco: Jossey-Bass.