Simple random sampling is the foundation of probability sampling in research. When done correctly, it gives every member of your population an equal and independent chance of selection, producing an unbiased sample that represents your population.
This guide covers everything you need to know about taking a simple random sample, from understanding the concept to implementing it step-by-step using common statistical tools.
What is a Simple Random Sample?
A simple random sample is a subset of a population where each member has an equal probability of being selected, and each selection is independent of others.
Two key characteristics define a simple random sample:
- Equal probability: Every population member has the same chance of selection
- Independence: Selecting one member doesn't affect the probability of selecting another
For example, if you have a population of 1,000 students and want to select 100 for a survey, each student has a 100/1,000 = 10% chance of selection in a simple random sample.
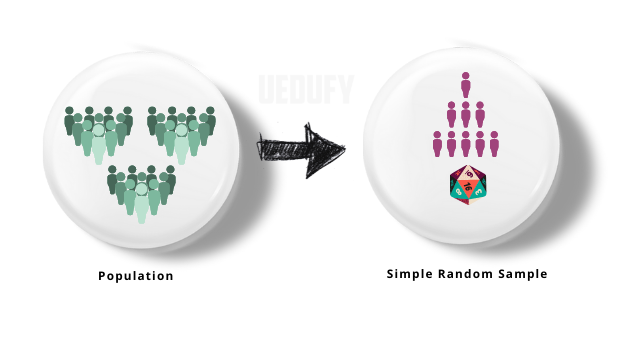 Population vs. Simple Random Sample: How random selection produces a representative subset
When to Use Simple Random Sampling
Simple random sampling works best when:
- You have a complete list of all population members
- The population is relatively homogeneous
- You need an unbiased representative sample
- You want to make statistical inferences about the population
- You have sufficient resources to reach any selected member
Simple random sampling is less appropriate when:
- The population is highly heterogeneous (use stratified sampling instead)
- You don't have a complete population list
- Some population members are difficult or costly to reach
- You need to ensure representation of specific subgroups
How to Take a Simple Random Sample: 4 Steps
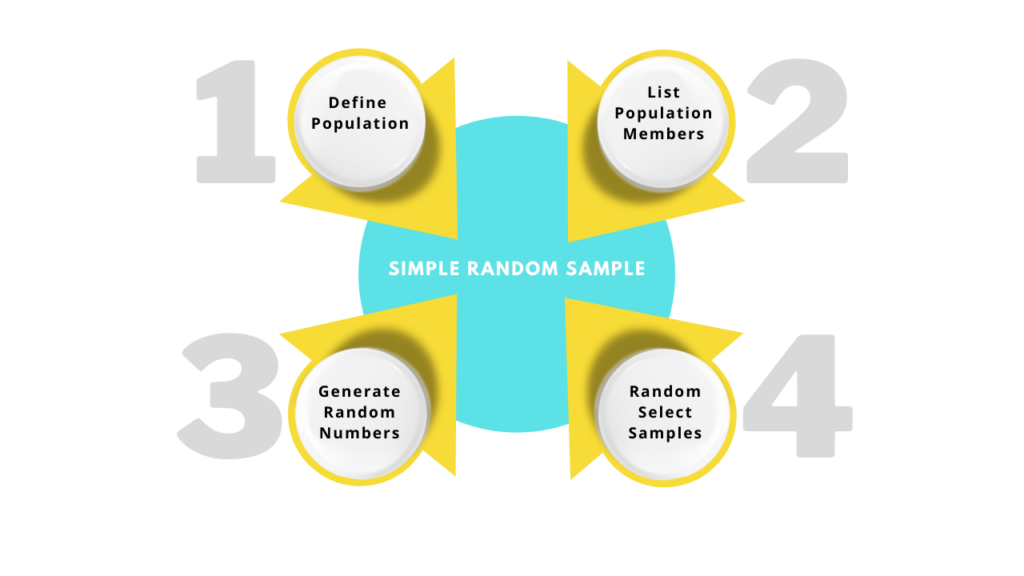 The 4 essential steps to conduct simple random sampling
Step 1: Define Your Population
Clearly identify the population you want to study. This includes determining:
- Population boundaries: Who is included and who is excluded?
- Population size (): How many members are in the complete population?
- Sample size (): How many members will you select?
Example: You want to study employee satisfaction at a company with 500 employees. Your population is all 500 current full-time employees, and you decide to select a sample of 50 employees.
Step 2: Create a Sampling Frame
A sampling frame is a complete list of all population members. Each member needs a unique identifier (usually a number).
Requirements for a good sampling frame:
- Complete: Includes all population members
- Up-to-date: Reflects current membership
- No duplicates: Each member appears only once
- Numbered sequentially: From 1 to
Example: Export your employee database to a spreadsheet. Assign numbers 1 through 500 to each employee.
| ID Number | Employee Name | Department |
|---|---|---|
| 1 | John Smith | Marketing |
| 2 | Sarah Johnson | Sales |
| 3 | Michael Brown | IT |
| ... | ... | ... |
| 500 | Emily Davis | HR |
Step 3: Generate Random Numbers
Use a random number generator to select unique numbers between 1 and . You have several options:
Method 1: Excel/Google Sheets
In Excel, use the RANDBETWEEN function:
=RANDBETWEEN(1, 500)
Copy this formula down 50 rows to generate 50 random numbers. Important: Remove duplicates to ensure exactly 50 unique selections.
Method 2: Random Number Table
Statistical random number tables provide pre-generated random digits. Start at a random point and read across or down to select your numbers.
Method 3: R Programming
# Generate 50 random numbers from 1 to 500
sample(1:500, 50, replace = FALSE)
Method 4: Python
import random
random.sample(range(1, 501), 50)
Method 5: Online Random Number Generator
Many free online tools can generate random numbers without replacement for sampling purposes.
Step 4: Select Your Sample
Match the random numbers from Step 3 to the ID numbers in your sampling frame from Step 2.
Example: If your random numbers include 7, 23, 45, 127, 248, etc., you would select:
- Employee #7
- Employee #23
- Employee #45
- Employee #127
- Employee #248
- (and 45 more)
These selected individuals comprise your simple random sample of 50 employees.
Simple Random Sampling Example: Student Survey
Let's work through a complete example.
Scenario: A university professor wants to survey students in a course with 200 enrolled students about their learning preferences.
Step 1: Define the population
- Population: All 200 students enrolled in the course
- Sample size: 40 students (20% of population)
Step 2: Create sampling frame
- Export class roster from learning management system
- Assign numbers 1-200 to each student alphabetically
Step 3: Generate random numbers using Excel
- Formula:
=RANDBETWEEN(1, 200) - Generate 40 unique random numbers
Sample random numbers generated:
| Selection Order | Random Number | Selection Order | Random Number |
|---|---|---|---|
| 1 | 17 | 21 | 156 |
| 2 | 43 | 22 | 89 |
| 3 | 127 | 23 | 198 |
| 4 | 5 | 24 | 34 |
| 5 | 189 | 25 | 112 |
| ... | ... | ... | ... |
Step 4: Select the sample
- Student #17, Student #43, Student #127, etc. are selected for the survey
- Total of 40 students selected
Simple Random Sampling in SPSS
SPSS provides built-in functionality for selecting random samples:
- Open your dataset with all population members
- Go to Data → Select Cases
- Choose "Random sample of cases"
- Click "Sample" button
- Choose one option:
- Approximately X% of cases (e.g., 20%)
- Exactly X cases from the first Y cases (e.g., 50 from 500)
- Click "Continue" then "OK"
SPSS will automatically select your random sample and create a filter variable indicating which cases are selected.
Simple Random Sampling Formula
While simple random sampling doesn't require complex calculations, understanding the probability of selection is important:
Where:
- = probability of any individual being selected
- = sample size
- = population size
Example: With a population of 500 and sample size of 50:
Each population member has a 10% chance of being selected.
Simple Random Sampling vs. Other Methods
Simple Random Sampling vs. Stratified Sampling
| Feature | Simple Random Sampling | Stratified Sampling |
|---|---|---|
| Population division | No subgroups | Divided into strata |
| Selection | Random from entire population | Random within each stratum |
| Representation | May not represent subgroups | Guarantees subgroup representation |
| Best for | Homogeneous populations | Heterogeneous populations |
Simple Random Sampling vs. Systematic Sampling
| Feature | Simple Random Sampling | Systematic Sampling |
|---|---|---|
| Selection method | Fully random | Every kth member |
| Requires | Random number generator | Only starting point random |
| Ease | More complex | Simpler |
| Bias risk | Minimal | Possible if pattern exists |
Simple Random Sampling vs. Cluster Sampling
| Feature | Simple Random Sampling | Cluster Sampling |
|---|---|---|
| Unit of selection | Individuals | Groups (clusters) |
| Population list | Complete individual list | List of clusters only |
| Cost | Higher (dispersed sample) | Lower (geographically concentrated) |
| Precision | Higher | Lower (within-cluster similarity) |
Advantages of Simple Random Sampling
- Unbiased: No systematic bias in selection process
- Representative: Likely to reflect population characteristics
- Statistical validity: Allows use of probability theory for inference
- Simple to understand: Easy to explain and justify methodologically
- Equal opportunity: Every member has equal selection chance
Disadvantages of Simple Random Sampling
- Requires complete list: Need a comprehensive sampling frame
- May not represent subgroups: Small subgroups may be underrepresented by chance
- Potentially expensive: Selected members may be geographically dispersed
- Time-consuming: Creating sampling frame and random selection takes time
- Not ideal for heterogeneous populations: Other methods may be more efficient
Common Mistakes to Avoid
Not removing duplicates: If your random number generator produces duplicates, your sample size will be smaller than intended.
Using non-random starting points: Starting systematically (e.g., always from the top) introduces bias.
Incomplete sampling frame: Missing population members means they have zero selection probability, violating the equal probability requirement.
Replacing non-respondents non-randomly: If selected members don't participate, replacing them with convenient alternatives destroys randomness.
Confusing random sampling with random assignment: Random sampling selects participants from a population; random assignment allocates participants to experimental conditions.
Conclusion
Simple random sampling provides an unbiased, statistically valid method for selecting a sample that represents your population. While it requires a complete sampling frame and may not be the most efficient method for heterogeneous populations, its simplicity and statistical properties make it a fundamental technique in research.
Follow the four steps (define your population, create a sampling frame, generate random numbers, and select your sample) to implement simple random sampling correctly. Choose appropriate random number generation tools for your context, and avoid common pitfalls like incomplete sampling frames or non-random replacement of non-respondents.
When your population is heterogeneous or contains important subgroups, consider alternative probability sampling methods like stratified or cluster sampling. The key is matching your sampling method to your research questions, population characteristics, and available resources.
References
Cochran, W. G. (1977). Sampling Techniques (3rd ed.). John Wiley & Sons.
Kalton, G. (1983). Introduction to Survey Sampling. SAGE Publications.
Lohr, S. L. (2021). Sampling: Design and Analysis (3rd ed.). CRC Press.
Thompson, S. K. (2012). Sampling (3rd ed.). John Wiley & Sons.