Stratified sampling is a probability sampling technique where researchers divide a population into distinct subgroups (called strata) based on shared characteristics, then randomly select samples from each stratum proportionally. This method ensures that specific subgroups are adequately represented in the final sample, making it particularly valuable when studying diverse populations.
This guide explains what stratified sampling is, how it differs from other sampling methods, step-by-step implementation procedures, real-world examples, and when you should use this technique in your research.
What is Stratified Sampling?
Stratified sampling (also called stratified random sampling) is a probability sampling method that divides a population into homogeneous subgroups (strata) based on specific characteristics, then randomly selects samples from each stratum. The key principle is that every member of the population belongs to exactly one stratum, and the sample maintains the same proportions as the original population.
Key Components
Strata: Distinct, non-overlapping subgroups within a population defined by shared characteristics. Each population member belongs to exactly one stratum.
Proportional representation: The sample composition mirrors the population structure. If 30% of your population is Group A, then 30% of your sample should be Group A.
Random selection within strata: After dividing the population into strata, researchers use random sampling techniques (like simple random sampling) within each stratum to select participants.
How Stratified Sampling Works
The fundamental process involves three stages:
- Divide the population into mutually exclusive strata based on relevant characteristics
- Determine sample size for each stratum (proportional or disproportional allocation)
- Randomly select the specified number of participants from each stratum
This approach combines the benefits of controlled sampling (through stratification) with the statistical validity of random selection (within each stratum).
Stratified Sampling vs. Other Sampling Methods
Understanding how stratified sampling differs from other probability sampling techniques helps you choose the right method for your research.
Stratified Sampling vs. Simple Random Sampling
Simple random sampling selects participants randomly from the entire population without dividing it into groups. Every individual has an equal chance of selection.
Difference: Stratified sampling guarantees representation of specific subgroups, while simple random sampling may accidentally under-represent or over-represent certain groups purely by chance.
Example: If your population is 70% male and 30% female, simple random sampling might produce a sample that is 80% male and 20% female. Stratified sampling ensures your sample maintains the 70/30 split.
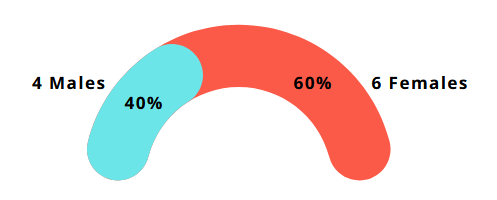
Proportional representation in stratified sampling - maintaining the same gender ratio from population to sample
When to choose stratified over simple random: Use stratified sampling when you need to ensure specific subgroups are represented proportionally, especially when studying diverse populations with important categorical differences.
Stratified Sampling vs. Cluster Sampling
Cluster sampling divides the population into clusters (like geographic regions or schools), then randomly selects entire clusters and surveys all members within chosen clusters.
Difference: Stratified sampling selects some individuals from every stratum, while cluster sampling selects all individuals from some clusters and none from others.
Example:
- Stratified: Divide students by grade level (9th, 10th, 11th, 12th), then randomly select 50 students from each grade
- Cluster: Randomly select 5 schools from 20 total schools, then survey all students in those 5 schools
When to choose stratified over cluster: Use stratified sampling when you can access the entire population and want to ensure all subgroups are represented. Use cluster sampling when geographic or logistical constraints make it impractical to sample across the entire population.
Stratified Sampling vs. Systematic Sampling
Systematic sampling selects every nth individual from a list of the population (e.g., every 10th person).
Difference: Stratified sampling actively ensures subgroup representation through deliberate grouping, while systematic sampling relies on list order and sampling interval.
When to choose stratified over systematic: Use stratified sampling when population composition matters and you want guaranteed representation of specific groups. Use systematic sampling when you have a complete list and population characteristics are evenly distributed.
Step-by-Step: How to Conduct Stratified Sampling
Follow this systematic procedure to implement stratified sampling in your research.
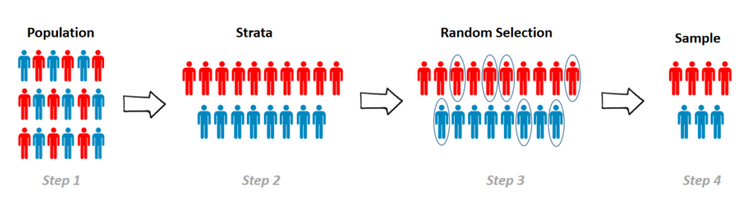
The stratified sampling process - dividing population into strata, then randomly selecting from each stratum
Step 1: Define Your Population
Clearly identify the complete group you want to study. The population should be relevant to your research question and well-defined by specific inclusion and exclusion criteria.
Example: If researching employee satisfaction at a company, your population might be "all full-time employees who have worked at the company for at least 6 months as of January 1, 2025."
Important considerations:
- Define boundaries clearly (who is included and excluded)
- Ensure you can access a complete list of population members
- Determine total population size (N)
Step 2: Identify Stratification Variables
Choose the characteristic(s) that will define your strata. This variable should be:
- Relevant to your research question
- Categorical (not continuous)
- Exhaustive (every population member fits into one category)
- Mutually exclusive (no one fits into multiple categories)
Common stratification variables:
- Demographic: Age groups, gender, ethnicity, education level
- Geographic: Region, state, urban/rural, climate zone
- Socioeconomic: Income brackets, employment status, occupation
- Behavioral: Customer type, product usage frequency, voting history
Example: For an employee satisfaction study, you might stratify by department (Sales, Engineering, Marketing, HR, Operations) to ensure each department's voice is heard proportionally.
Step 3: Divide the Population into Strata
Assign each population member to exactly one stratum based on your chosen stratification variable.
Requirements:
- Strata must be mutually exclusive (no overlap)
- Strata must be collectively exhaustive (everyone fits somewhere)
- Strata should be homogeneous within (members share similar characteristics)
- Strata should be heterogeneous between (different strata have different characteristics)
Example: In a company with 1,000 employees:
- Sales: 300 employees (30%)
- Engineering: 400 employees (40%)
- Marketing: 150 employees (15%)
- HR: 50 employees (5%)
- Operations: 100 employees (10%)
Step 4: Determine Sample Size for Each Stratum
Calculate how many participants to select from each stratum. There are two main approaches:
Proportional Stratified Sampling (Recommended)
Sample size for each stratum is proportional to that stratum's size in the population. This maintains the population's natural composition.
Formula:
Where:
- = sample size for stratum h
- = population size of stratum h
- = total population size
- = total desired sample size
Example: If you want a total sample of 200 from 1,000 employees:
- Sales: (300/1,000) × 200 = 60 participants
- Engineering: (400/1,000) × 200 = 80 participants
- Marketing: (150/1,000) × 200 = 30 participants
- HR: (50/1,000) × 200 = 10 participants
- Operations: (100/1,000) × 200 = 20 participants
Disproportional Stratified Sampling (Special Cases)
Deliberately over-sample or under-sample certain strata. Use this when:
- Small strata need sufficient sample sizes for analysis (minimum of 30 for statistical validity)
- You want to compare groups with equal statistical power
- Research questions focus on specific subgroups
Example: To ensure adequate HR representation for analysis, you might sample 30 from HR (instead of 10) while adjusting other strata downward.
Important: When using disproportional sampling, you must apply statistical weighting during analysis to adjust for the non-proportional selection.
Step 5: Randomly Select Participants Within Each Stratum
Use simple random sampling within each stratum to select the required number of participants.
Methods:
-
Random number generation: Assign each stratum member a number, then use a random number generator to select participants
-
Lottery method: Write all member IDs on slips, mix thoroughly, and draw the required number
-
Software tools: Use Excel's RAND() function, R's sample() function, or SPSS's random selection features
Example in Excel:
- List all Sales department employees (300 total)
- Assign each a number (1-300)
- Generate 60 random numbers between 1 and 300 using
=RANDBETWEEN(1,300) - Select employees matching those numbers
- Repeat for each stratum
Critical requirement: Selection within each stratum must be truly random. Every member of a stratum must have an equal probability of selection.
Step 6: Combine Samples and Collect Data
After selecting participants from all strata, combine them into your final sample and proceed with data collection.
Final sample composition (from our example):
- Total sample size: 200 participants
- Sales: 60 (30%)
- Engineering: 80 (40%)
- Marketing: 30 (15%)
- HR: 10 (5%)
- Operations: 20 (10%)
This sample perfectly mirrors the population's departmental distribution, ensuring proportional representation.
Real-World Examples of Stratified Sampling
Example 1: University Student Satisfaction Survey
Research question: What is the overall satisfaction level of students at a university?
Population: 10,000 enrolled students
Stratification variable: Academic year (Freshman, Sophomore, Junior, Senior)
Population breakdown:
- Freshman: 3,000 (30%)
- Sophomore: 2,500 (25%)
- Junior: 2,500 (25%)
- Senior: 2,000 (20%)
Sampling approach: Proportional stratified sampling with total sample size of 400
Sample allocation:
- Freshman: 120 students
- Sophomore: 100 students
- Junior: 100 students
- Senior: 80 students
Why stratified sampling: Each academic year has different experiences and perspectives. Freshman focus on orientation and adjustment, seniors focus on graduation and career placement. Stratified sampling ensures all perspectives are represented proportionally.
Alternative problem: If using simple random sampling with 400 students, you might accidentally get 150 freshmen and only 50 seniors, which wouldn't represent the senior experience adequately.
Example 2: Political Poll Across a State
Research question: Which candidate do voters prefer in an upcoming election?
Population: 5,000,000 registered voters in the state
Stratification variables: Region (North, South, East, West, Central)
Population breakdown:
- North: 1,500,000 (30%)
- South: 1,000,000 (20%)
- East: 1,250,000 (25%)
- West: 750,000 (15%)
- Central: 500,000 (10%)
Sampling approach: Proportional stratified sampling with total sample size of 2,000
Sample allocation:
- North: 600 voters
- South: 400 voters
- East: 500 voters
- West: 300 voters
- Central: 200 voters
Why stratified sampling: Different regions often have distinct political preferences based on urban/rural differences, economic conditions, and local issues. Stratified sampling ensures accurate statewide predictions by proportionally representing each region's voting power.
Example 3: Healthcare Access Study
Research question: How satisfied are patients with hospital services?
Population: 50,000 patients who visited a hospital system in the past year
Stratification variable: Insurance type (Private insurance, Medicare, Medicaid, Uninsured)
Population breakdown:
- Private insurance: 25,000 (50%)
- Medicare: 12,500 (25%)
- Medicaid: 10,000 (20%)
- Uninsured: 2,500 (5%)
Sampling approach: Disproportional stratified sampling to ensure adequate uninsured representation
Sample allocation (total sample: 1,000):
- Private insurance: 400 (instead of 500)
- Medicare: 250
- Medicaid: 200
- Uninsured: 150 (instead of 50)
Why disproportional: The uninsured group is small (5%) but critically important for healthcare policy. Sampling only 50 uninsured patients wouldn't provide sufficient statistical power for meaningful analysis. By over-sampling this stratum and applying statistical weights during analysis, researchers can compare satisfaction across insurance types with equal precision.
Example 4: Manufacturing Quality Control
Research question: What is the defect rate across production batches?
Population: 100 production batches manufactured in a month
Stratification variable: Production shift (Morning, Afternoon, Night)
Population breakdown:
- Morning shift: 40 batches (40%)
- Afternoon shift: 35 batches (35%)
- Night shift: 25 batches (25%)
Sampling approach: Proportional stratified sampling with 20 batches inspected
Sample allocation:
- Morning shift: 8 batches
- Afternoon shift: 7 batches
- Night shift: 5 batches
Why stratified sampling: Different shifts may have different defect rates due to worker fatigue, equipment temperature variations, or supervision levels. Stratified sampling ensures quality control analysis represents all shifts proportionally.
Advantages of Stratified Sampling
1. Guaranteed Subgroup Representation
Stratified sampling ensures that important subgroups within your population are represented in your sample. Unlike simple random sampling, which might accidentally under-represent minority groups, stratified sampling guarantees proportional inclusion.
Practical impact: If 5% of your population is from a specific ethnic group, stratified sampling ensures that approximately 5% of your sample represents that group, preventing their voices from being lost in the data.
2. Increased Precision and Reduced Sampling Error
Because stratified sampling accounts for population heterogeneity, it typically produces estimates with smaller standard errors compared to simple random sampling of the same size.
Statistical benefit: Stratification reduces variance within strata, which reduces overall sampling error. This means you can achieve the same level of precision with a smaller sample size, or greater precision with the same sample size.
3. Enables Subgroup Analysis
By ensuring adequate representation of each stratum, stratified sampling facilitates meaningful comparisons between groups.
Research value: You can analyze differences between strata (e.g., comparing satisfaction levels across departments, age groups, or regions) with sufficient statistical power for each subgroup.
4. More Representative of Population Characteristics
Stratified samples better reflect the true composition of the population across known characteristics, leading to more accurate population estimates.
Accuracy advantage: If you know your population is 60% urban and 40% rural, stratified sampling maintains this ratio, ensuring your findings accurately represent both geographic contexts.
5. Flexibility in Sampling Strategy
Researchers can use proportional allocation (maintaining population proportions) or disproportional allocation (over-sampling small but important groups) depending on research objectives.
Adaptive approach: This flexibility allows you to balance statistical representation with practical research needs, such as ensuring minimum sample sizes for subgroup analysis.
Disadvantages of Stratified Sampling
1. Requires Complete Population Information
Stratified sampling requires detailed knowledge of the population's composition across stratification variables. You must know how to classify every population member before sampling.
Practical challenge: This requirement can be difficult or impossible when:
- Complete population lists are unavailable
- Stratification variables are sensitive or unknown (e.g., income levels, health conditions)
- Population characteristics change rapidly
Example: If you want to stratify by income but don't have income data for all population members, you cannot properly implement stratified sampling.
2. Time-Consuming and Resource-Intensive
Creating strata, determining appropriate allocation, and conducting separate random selections for each stratum requires more time and effort than simple random sampling.
Resource implications:
- Data management complexity increases with number of strata
- Separate sampling procedures needed for each stratum
- Administrative burden of tracking multiple subsamples
3. Risk of Inappropriate Stratification
Choosing the wrong stratification variables can reduce efficiency or introduce bias.
Potential problems:
- Irrelevant variables waste resources without improving precision
- Omitting important stratification variables misses opportunities for variance reduction
- Too many stratification variables create numerous small strata, complicating analysis
Example: Stratifying by eye color in a political survey adds complexity without improving accuracy, as eye color isn't related to political preferences.
4. Complexity in Statistical Analysis
Disproportional stratified sampling requires statistical weighting during analysis to adjust for non-proportional selection, increasing analytical complexity.
Technical requirement: Researchers must apply appropriate weights and use weighted analysis procedures, which requires statistical expertise and can complicate interpretation.
5. May Not Reduce Bias if Strata are Poorly Defined
If strata are heterogeneous internally (members within a stratum are very different from each other), stratification provides minimal benefit over simple random sampling.
Effectiveness depends on: How well stratification variables capture meaningful population divisions. Poor stratification choices waste resources without improving sample quality.
When to Use Stratified Sampling
Stratified sampling is most appropriate in specific research scenarios. Use this method when:
1. Your Population is Heterogeneous
When your population contains distinct subgroups that differ on variables relevant to your research question, stratified sampling ensures all perspectives are captured.
Indicators: Population varies significantly by demographics, geography, behavior, or other categorical characteristics that matter for your study.
2. You Need Subgroup Comparisons
If your research requires analyzing and comparing different groups (e.g., comparing satisfaction across age groups, regions, or customer segments), stratified sampling ensures adequate representation for statistical comparisons.
Research objective: Studies designed to identify differences between groups or examine how variables operate differently across subpopulations.
3. You Have Complete Population Information
Stratified sampling requires knowing the stratification variable for every population member. Use this method only when you have access to complete, accurate population data.
Data availability: Organizational databases, government records, or comprehensive lists that include stratification variables for all members.
4. Certain Subgroups are Small but Important
When minority groups represent a small percentage of your population but are critical to your research, disproportional stratified sampling allows you to over-sample these groups while maintaining statistical validity through weighting.
Application: Studies of rare populations, minority experiences, or special subgroups that would be under-represented in simple random samples.
5. You Want to Improve Precision
When statistical precision is important and you can identify variables that explain variance in your outcome, stratified sampling reduces sampling error compared to simple random sampling of equivalent size.
Efficiency goal: Achieving more accurate population estimates with smaller sample sizes or greater precision with the same resources.
When NOT to Use Stratified Sampling
Avoid stratified sampling when:
- You lack information about stratification variables for population members
- Your population is homogeneous (members are similar across relevant characteristics)
- You have limited time and resources, and simple random sampling is sufficient
- No clear, relevant stratification variables exist for your research question
- Strata would be extremely unbalanced (e.g., one stratum contains 95% of the population)
Common Mistakes in Stratified Sampling
Mistake 1: Overlapping Strata
Problem: Creating strata that aren't mutually exclusive, so some population members could belong to multiple strata.
Example: Stratifying by "age 18-25" and "college students" creates overlap because many college students are 18-25.
Solution: Ensure every population member belongs to exactly one stratum. Use clearly defined, non-overlapping categories.
Mistake 2: Using Continuous Variables for Stratification
Problem: Attempting to stratify using continuous variables without creating discrete categories.
Example: Trying to stratify by "income" without defining income brackets.
Solution: Convert continuous variables into meaningful categorical ranges (e.g., income brackets: under 30k-60k-100k).
Mistake 3: Too Many Strata
Problem: Creating excessive strata that result in very small sample sizes per stratum, reducing statistical power and complicating analysis.
Example: Stratifying a sample of 100 by 20 different job titles results in only 5 people per stratum on average.
Solution: Limit stratification to the most important variables. Combine small strata when appropriate. Follow the guideline of at least 30 observations per stratum for adequate statistical analysis.
Mistake 4: Ignoring Within-Stratum Randomization
Problem: Selecting participants from strata using convenience or judgment methods rather than random selection.
Example: Choosing the "most available" participants from each department rather than randomly selecting them.
Solution: Always use random selection methods within each stratum. The validity of stratified random sampling depends on randomization within strata.
Mistake 5: Forgetting to Weight Disproportional Samples
Problem: Analyzing data from disproportional stratified samples without applying statistical weights, leading to biased population estimates.
Example: If you over-sampled a minority group to ensure adequate representation, treating all observations equally inflates that group's influence on overall statistics.
Solution: When using disproportional allocation, calculate and apply appropriate weights during analysis. Weight = (Stratum population proportion) / (Stratum sample proportion).
Stratified Sampling in Statistical Software
Most statistical software packages support stratified sampling and weighted analysis:
Excel: Use RANDBETWEEN() function for random selection within strata. Manual process but accessible.
R: Use strata() from the sampling package or sample() with subsetting for stratified selection.
Python: Use stratified_sample() from pandas or scikit-learn's train_test_split() with stratification.
SPSS: Use Data → Select Cases → Random sample with stratification syntax or Complex Samples module for design and analysis.
SAS: Use PROC SURVEYSELECT with METHOD=SRS and STRATA statement for stratified random sampling.
Stata: Use sample or bsample commands with by-groups for stratification, and svyset for survey design specification.
Wrapping Up
Stratified sampling is a powerful probability sampling technique that divides populations into homogeneous subgroups, then randomly selects participants from each stratum to ensure proportional representation. By combining structured stratification with random selection, this method guarantees that important subgroups are adequately represented while maintaining statistical validity.
The key to successful stratified sampling lies in choosing appropriate stratification variables, properly allocating sample sizes across strata, and conducting truly random selection within each stratum. When implemented correctly, stratified sampling increases precision, reduces sampling error, and enables meaningful subgroup analysis compared to simple random sampling.
Whether you're conducting survey research, quality control testing, or population studies, stratified sampling provides a systematic approach to capturing population diversity while maintaining statistical rigor. Understanding when to use proportional versus disproportional allocation, avoiding common mistakes like overlapping strata, and properly weighting disproportional samples during analysis ensures your research produces accurate, representative findings.
References
- Cochran, W. G. (1977). Sampling Techniques (3rd ed.). John Wiley & Sons.
- Lohr, S. L. (2021). Sampling: Design and Analysis (3rd ed.). Chapman and Hall/CRC.
- Thompson, S. K. (2012). Sampling (3rd ed.). Wiley.
- Scheaffer, R. L., Mendenhall III, W., Ott, R. L., & Gerow, K. G. (2011). Elementary Survey Sampling (7th ed.). Cengage Learning.