Choosing a dissertation topic requires balancing personal interest, academic contribution, and practical feasibility within your timeline. This guide presents five complete quantitative research ideas designed to help you develop a solid research foundation.
Each research idea includes comprehensive components: research questions, hypotheses, variables, methodology, data analysis approaches, and interpretation guidance. The examples progress from simple bivariate relationships to complex mediation and moderation analyses, allowing you to select one that matches your experience level and research interests.
All five examples use stratified sampling as the primary sampling method. If you need to understand this technique, refer to our guide on stratified sampling before proceeding.
Idea 1: Sleep Quality and Academic Performance
Sleep represents a critical factor in student well-being that often receives insufficient attention during academic periods. This research idea examines the direct relationship between sleep quality and academic performance among college students.
Research Question
"How does sleep quality influence academic performance among college students?"
Hypotheses
H1: Better sleep quality is positively associated with improved academic performance.
H2: Regular sleep schedules lead to higher grades compared to inconsistent sleep patterns.
Research Variables
This study examines two primary variables:
Independent Variable (X):
- Sleep Quality (measured by sleep duration, latency, efficiency, and disturbances)
Dependent Variable (Y):
- Academic Performance (measured by GPA and exam scores)
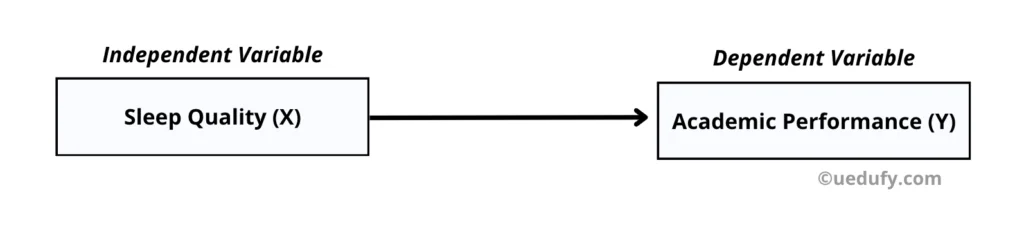 Path diagram for Research Idea 1 (two variables).
Methodology
Population and Sample Size: 300 college students from various majors. This sample size provides adequate statistical power and reduces the risk of Type II errors while ensuring diversity across academic disciplines.
Research Instruments:
Sleep Quality: The Pittsburgh Sleep Quality Index (PSQI) assesses sleep over the past month using a Likert scale from 0 to 3. This validated instrument measures seven components: subjective sleep quality, sleep latency, sleep duration, habitual sleep efficiency, sleep disturbances, use of sleeping medication, and daytime dysfunction.
Academic Performance: Collect GPA and exam scores from university records or verified self-reported data. University records provide more reliable data when accessible.
Data Collection Procedure: Distribute questionnaires twice per semester (early and late) to capture temporal variations. Collect academic performance data after final grades are officially released to ensure accuracy.
Ethical Considerations: All participants sign informed consent forms explaining the study's purpose, their rights to confidentiality and anonymity, and their ability to withdraw at any time without consequence.
Data Analysis
Conduct the following analyses using SPSS or R:
Descriptive Statistics: Calculate means, standard deviations, and ranges for all variables to establish baseline characteristics of your sample.
Correlation Analysis: Perform Pearson correlation to assess the strength and direction of the relationship between sleep quality and academic performance.
Regression Analysis: Use simple linear regression to determine the extent to which sleep quality predicts academic performance and quantify the variance explained.
Expected Results:
Previous literature suggests a positive relationship between sleep quality and academic outcomes. Key metrics to examine:
| Metric | Value | Interpretation |
|---|---|---|
| Pearson Correlation | r = 0.XX | Strength and direction of the relationship between sleep quality and grades. |
| P-value | p = 0.XXX | Statistical significance; values below 0.05 indicate significant relationships. |
| R-squared (R²) | R² = 0.XX | Proportion of variance in grades explained by sleep quality. |
Key statistics metrics for Research Idea 1. Note: XX represents your actual values.
Results Interpretation
In your Discussion section, begin by summarizing the main findings regarding how sleep quality impacts academic performance. Explain both the statistical significance and practical significance of your results.
Discuss practical implications for university policy and student support services. For example, how might institutions use these findings to develop sleep education programs or adjust academic schedules to promote healthier sleep patterns?
Compare your results with existing literature to contextualize your findings within the broader research landscape. Acknowledge limitations such as reliance on self-reported data and suggest future research directions, including the use of objective sleep tracking devices or longitudinal designs to establish temporal precedence.
Idea 2: Study Habits and Social Media Use on Academic Performance
The proliferation of social media has fundamentally changed how students manage their time and attention. This research idea examines the combined effects of study habits and social media use on academic outcomes, introducing multiple predictor variables.
Research Question
"What is the combined effect of study habits and social media use on students' academic performance?"
Hypotheses
H1: Strong study habits are positively associated with academic performance.
H2: High social media usage is negatively associated with academic performance.
Research Variables
This study examines three variables:
Independent Variables (X):
- Study Habits (frequency, duration, and effectiveness of study sessions)
- Social Media Use (daily time spent on social media platforms)
Dependent Variable (Y):
- Academic Performance (GPA and exam scores)
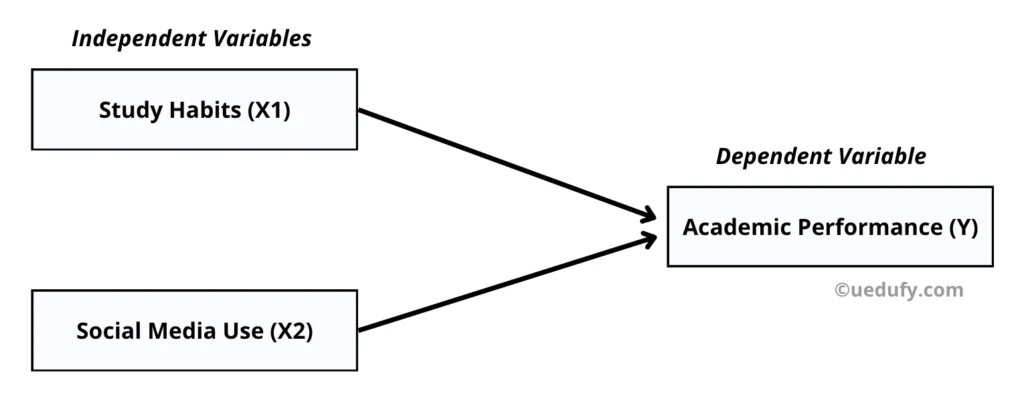 Path diagram for Research Idea 2 (three variables).
Methodology
Population and Sample Size: 400 students from different faculties to ensure diversity across academic disciplines and study demands.
Research Instruments: Develop a comprehensive questionnaire with three sections:
Study Habits: Questions assessing study frequency, duration, techniques employed, and consistency of study schedules.
Social Media Use: Questions measuring daily usage duration, platforms used, and purposes of use (entertainment, education, social connection).
Academic Performance: Collect from university records when possible, or use verified self-reports with GPA documentation.
Data Collection Procedure: Administer surveys at two time points (beginning and end of semester) to capture changes and establish temporal relationships. This approach helps control for seasonal variations in study patterns.
Ethical Considerations: Prepare comprehensive informed consent forms describing the study purpose, data privacy measures, confidentiality protections, and participants' right to withdraw without penalty.
Data Analysis
Using SPSS or R, conduct:
Descriptive Statistics: Summarize central tendencies and variability for study time, social media use, and academic performance.
Multiple Linear Regression: Examine how both study habits and social media use simultaneously predict academic performance. This analysis reveals the unique contribution of each predictor while controlling for the other.
Follow our Multiple Linear Regression guide for detailed implementation steps.
Expected Results:
Study habits should demonstrate a positive effect on grades, while social media use may show a negative effect. Key metrics to examine:
| Metric | Value | Interpretation |
|---|---|---|
| Regression Coefficient (Study Habits) | β = 0.XX | Impact of study habits on academic performance. |
| Regression Coefficient (Social Media) | β = 0.XX | Impact of social media use on academic performance. |
| P-value | p = 0.XXX | Statistical significance; below 0.05 indicates significant effects. |
| R-squared (R²) | R² = 0.XX | Variance in grades explained by both predictors combined. |
Key statistics metrics for Research Idea 2. Note: XX represents your actual values.
Results Interpretation
In your Discussion, explain how study habits and social media use jointly influence academic outcomes. Consider whether the effects are independent or whether they interact in meaningful ways.
Explore whether students with strong study habits demonstrate greater resistance to social media distractions. Recognize that not all social media use is detrimental. Some students effectively use these platforms for study groups, educational content, and academic collaboration.
Compare findings with previous research and acknowledge limitations including self-reported data and the correlational nature of the design. Suggest future directions such as longitudinal studies to establish causality or examining specific social media platforms separately to identify differential effects.
Idea 3: Study Environment and Time Studying with Control Variables
This research idea adds methodological sophistication by incorporating control variables. You'll examine how study environment and study time affect academic outcomes while accounting for potential confounding factors.
Research Question
"How do study environment and time spent studying influence academic success when controlling for student major and previous academic performance?"
Hypotheses
H1: A supportive study environment is positively associated with academic performance.
H2: More time spent studying is positively associated with academic performance.
Research Variables
This study examines five variables:
Independent Variables (X):
- Study Environment (quality and conduciveness of study locations)
- Time Spent Studying (weekly hours dedicated to academic work)
Dependent Variable (Y):
- Academic Performance (current GPA and exam scores)
Control Variables (C):
- Student's Major (accounts for difficulty differences across academic disciplines)
- Previous Academic Performance (baseline GPA controls for existing academic ability)
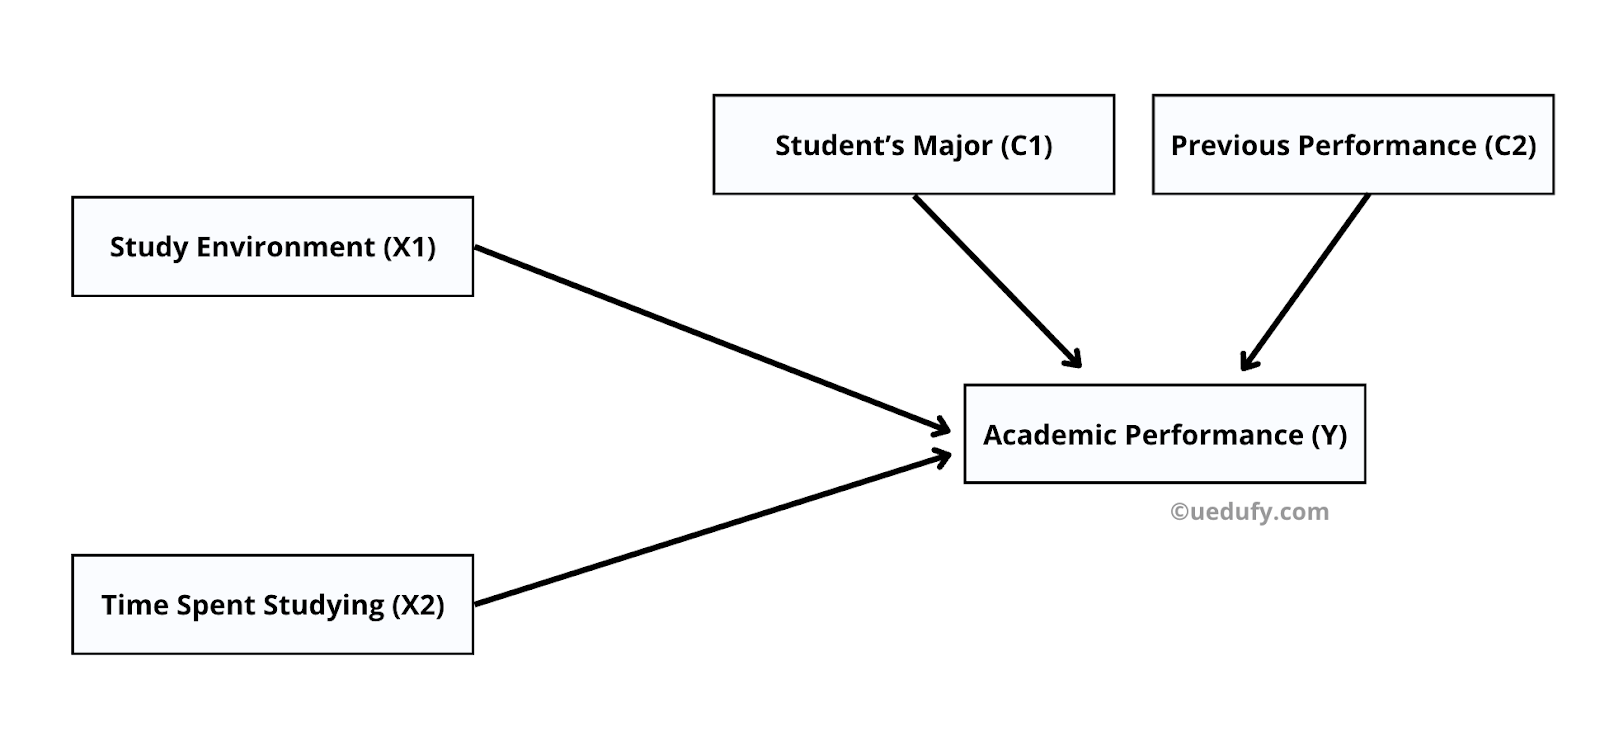 Path diagram for Research Idea 3 (with control variables).
Methodology
Population and Sample Size: 500 undergraduate students from various majors, recruited through stratified sampling to ensure proportional representation across disciplines.
Research Instruments:
Study Environment and Study Time: Questionnaire with Likert scales rating study location quality, noise levels, lighting, and comfort. Include study logs tracking weekly study hours.
Academic Performance: Use official university records when accessible, supplemented by verified self-reports.
Data Collection Procedure: Deploy online surveys early in the semester and at midpoint. Collect final grades at semester's end to capture the complete academic period.
Ethical Considerations: All participants sign informed consent forms with explicit details about the study purpose, data storage and protection measures, and withdrawal rights.
Data Analysis
Using SPSS or R:
Descriptive Statistics: Summarize all variables to identify patterns and distributions.
Multiple Linear Regression with Control Variables: Assess how study environment and study time predict grades while statistically controlling for major and previous performance. This approach isolates the unique effects of your primary predictors.
Expected Results:
Both study environment and study time should positively predict academic outcomes, even when controlling for major and baseline ability:
| Metric | Value | Interpretation |
|---|---|---|
| Regression Coefficient (Study Environment) | β = 0.XX | Impact of study environment on academic performance. |
| Regression Coefficient (Time Studying) | β = 0.XX | Impact of study hours on academic performance. |
| P-value | p = 0.XXX | Statistical significance; below 0.05 indicates significant effects. |
| R-squared (R²) | R² = 0.XX | Variance in grades explained by the complete model. |
Key statistics metrics for Research Idea 3. Note: XX represents your actual values.
Results Interpretation
In your Discussion, present how study environment and study time affect grades while considering student major and prior performance. Discuss what these findings mean for educational support systems and student services.
Compare with existing literature and highlight any unexpected findings. Acknowledge limitations such as the correlational design and potential unmeasured confounders. Suggest future research directions, including examining specific types of study environments (library versus home versus coffee shop) or investigating optimal study duration.
Idea 4: Mental Health as a Mediator Between Physical Activity and Academic Success
This research idea introduces mediation analysis, examining whether mental health explains the mechanism through which physical activity influences academic performance.
Research Question
"Does mental health mediate the relationship between physical activity and academic success in college students?"
Hypotheses
H1: Regular physical activity positively affects mental health.
H2: Better mental health positively affects academic performance.
H3: Mental health mediates the relationship between physical activity and academic performance.
Research Variables
Independent Variable (X):
- Physical Activity (frequency, duration, and intensity of exercise)
Dependent Variable (Y):
- Academic Performance (GPA and exam scores)
Mediator Variable (M):
- Mental Health (assessed using validated scales measuring stress, anxiety, depression, and overall well-being)
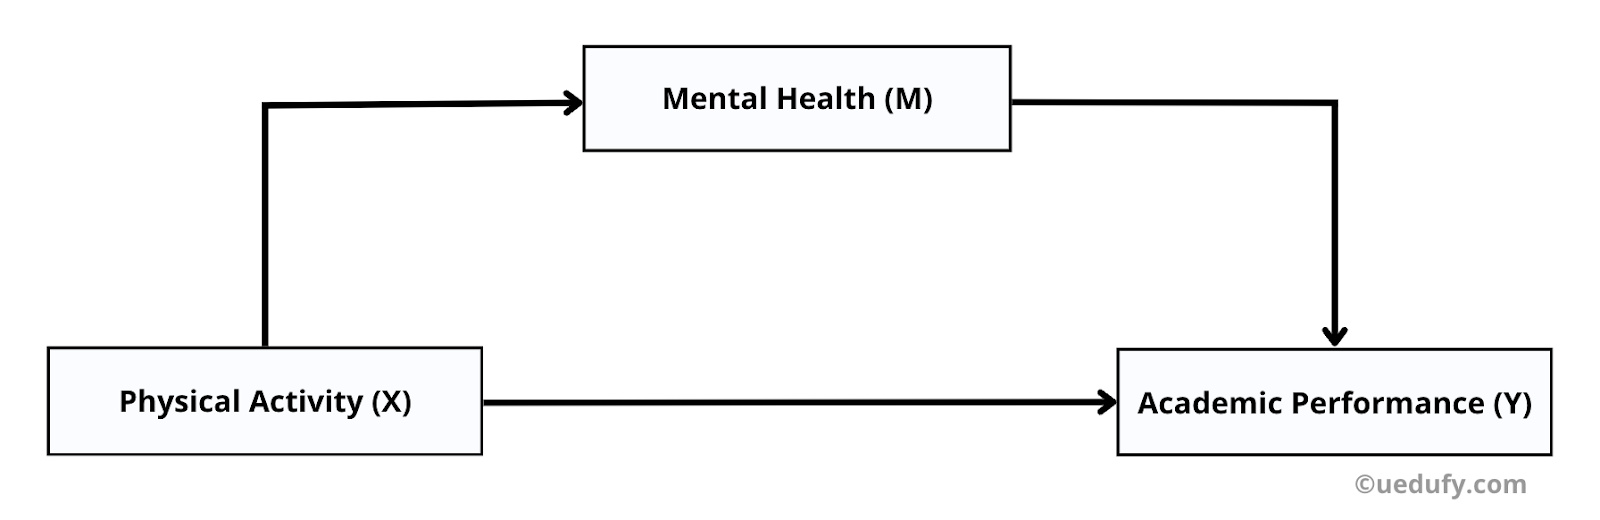 Path diagram for Research Idea 4 (mediation analysis).
Methodology
Population and Sample Size: 400 undergraduate students with varying physical activity levels to ensure adequate variability in the independent variable.
Research Instruments:
Physical Activity: Survey quantifying exercise types (aerobic, strength training, sports), weekly duration, and intensity levels using standardized scales.
Mental Health: Use validated psychological instruments such as the Depression Anxiety Stress Scales (DASS-21) or the General Health Questionnaire (GHQ-12) to measure psychological well-being.
Academic Performance: Combination of official university records and verified self-reported data.
Data Collection Procedure: Distribute online surveys early in the semester and conduct follow-up assessments as the term progresses. Collect final grades at semester's end to capture the complete academic period. Use Likert scales for physical activity frequency and mental health assessments.
Ethical Considerations: All participants sign informed consent forms before participation. Given the sensitive nature of mental health data, ensure robust confidentiality protections and provide mental health resources to participants who may need support.
Data Analysis
Using SPSS or R:
Descriptive Statistics: Establish baseline characteristics for all variables.
Mediation Analysis: Test whether mental health mediates the relationship between physical activity and academic performance. This involves examining:
- The effect of physical activity on mental health (path a)
- The effect of mental health on academic performance (path b)
- The direct effect of physical activity on academic performance (path c')
- The indirect effect through mental health (path a × b)
Learn detailed procedures in our SPSS mediation guide.
Expected Results:
Mental health should explain a significant portion of how physical activity translates into academic success:
| Metric | Value | Interpretation |
|---|---|---|
| Effect of Physical Activity on Mental Health (a) | β = 0.XX | How exercise influences mental well-being. |
| Effect of Mental Health on Academic Performance (b) | β = 0.XX | How mental health impacts grades. |
| Indirect Effect (a × b) | β = 0.XX | Mediated path from physical activity through mental health to grades. |
| Direct Effect (c') | β = 0.XX | Remaining direct effect of physical activity on grades. |
| P-value | p = 0.XXX | Statistical significance; below 0.05 indicates significant effects. |
Key statistics metrics for Research Idea 4. Note: XX represents your actual values.
Results Interpretation
In your Discussion, explain how physical activity influences academic outcomes through its effects on mental health. This pathway analysis could inform university wellness programs and academic support strategies.
Compare with existing research on the physical activity, mental health, and academic performance pathways. Discuss whether mental health fully or partially mediates the relationship. Address unexpected findings and explore practical implications for campus health policies and student support services.
Acknowledge limitations including the correlational design (which cannot definitively establish causality) and potential measurement error in self-reported physical activity. Suggest future research exploring other potential mediators such as sleep quality, social support, or self-efficacy.
Idea 5: Study Skills as a Moderator Between Classroom Environment and Achievement
This final research idea uses moderation analysis to examine whether study skills change the strength or direction of the relationship between classroom environment and student achievement.
Research Question
"Do study skills moderate the effect of classroom environment on student achievement?"
Hypotheses
H1: Positive classroom environments enhance student achievement.
H2: This effect is stronger for students with better study skills (moderation effect).
Research Variables
Independent Variable (X):
- Classroom Environment (quality, supportiveness, and conduciveness of the learning space)
Dependent Variable (Y):
- Student Achievement (course grades and test scores)
Moderator Variable (Z):
- Study Skills (time management, note-taking, information processing, and self-regulated learning abilities)
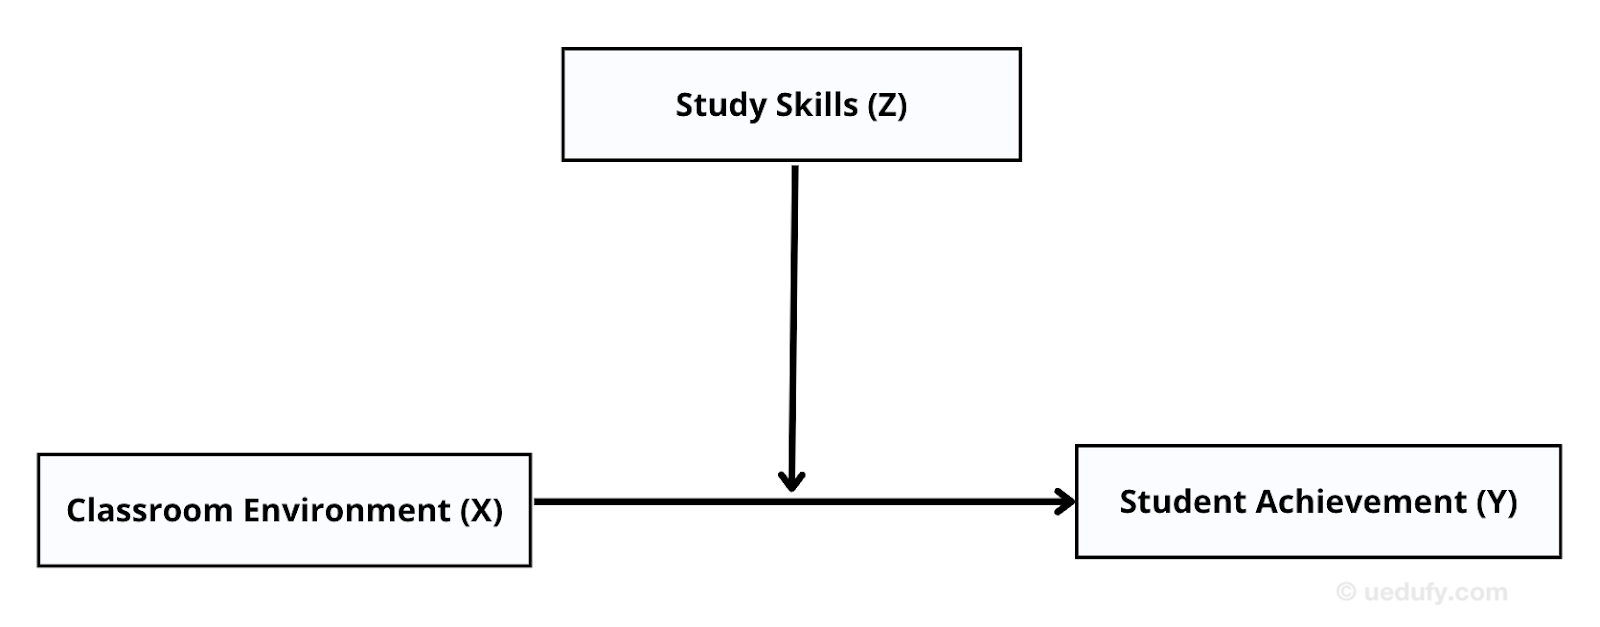 Path diagram for Research Idea 5 (moderation analysis).
Methodology
Population and Sample Size: 450 students from different faculties to ensure diverse findings across academic disciplines with varying demands.
Research Instruments:
Classroom Environment: Survey assessing physical comfort, instructor support, peer interaction quality, and opportunities for class participation.
Study Skills: Survey measuring organizational abilities, learning strategies, time management effectiveness, and metacognitive awareness using validated instruments.
Student Achievement: Official academic records or verified self-reported grades and test scores.
Data Collection Procedure: Administer surveys early in the semester and again near the end to measure changes and assess the stability of relationships over time.
Ethical Considerations: Informed consent forms clearly explain the study purpose, data protection measures, and participants' right to withdraw without academic penalty.
Data Analysis
Using SPSS or R:
Descriptive Statistics: Obtain comprehensive overview of baseline data for all variables.
Moderation Analysis: Test whether study skills influence the strength of the relationship between classroom environment and achievement. This involves:
- Main effect of classroom environment on achievement
- Main effect of study skills on achievement
- Interaction effect (Environment × Study Skills)
- Simple slopes analysis at different levels of study skills
Learn detailed procedures in our SPSS moderation guide.
Expected Results:
Students with stronger study skills should demonstrate greater benefit from positive classroom environments:
| Metric | Value | Interpretation |
|---|---|---|
| Effect of Classroom Environment | β = 0.XX | Main impact of classroom environment on achievement. |
| Effect of Study Skills | β = 0.XX | Main impact of study skills on achievement. |
| Interaction Effect (Environment × Study Skills) | β = 0.XX | How study skills modify the environment-achievement relationship. |
| P-value | p = 0.XXX | Statistical significance; below 0.05 indicates significant effects. |
| R-squared (R²) | R² = 0.XX | Variance in achievement explained by the complete model. |
Key statistics metrics for Research Idea 5. Note: XX represents your actual values.
Results Interpretation
In your Discussion, explain how study skills shape the benefits students derive from classroom environments. If the interaction is significant, interpret whether high study skills amplify the positive effects of good classroom environments or buffer against poor environments.
Compare findings with existing research on aptitude-treatment interactions and personalized learning. Discuss educational implications, particularly for differentiated instruction approaches and study skills training programs.
Acknowledge study limitations including potential selection bias and the challenge of isolating specific classroom environment components. Encourage future research to examine specific types of study skills separately or investigate other potential moderators such as student motivation or prior knowledge.
Frequently Asked Questions
Wrapping Up
This guide presented five quantitative research ideas progressing from simple bivariate relationships to complex mediation and moderation analyses. Each example includes comprehensive components needed for dissertation research: research questions, hypotheses, clearly defined variables, detailed methodology, data collection procedures, analysis approaches, and interpretation guidance.
Select the research idea that aligns with your interests, experience level, and timeline. Use these examples as templates and adapt them to your specific academic context, available resources, and disciplinary requirements.
Remember that successful dissertation research requires more than choosing a topic. It demands careful planning, consistent execution, and ongoing consultation with your advisor. These research ideas provide the foundation, but your unique perspective, theoretical framework, and methodological rigor will determine the final contribution to your field.
References
Creswell, J. W., & Creswell, J. D. (2018). Research Design: Qualitative, Quantitative, and Mixed Methods Approaches (5th ed.). SAGE Publications.
Field, A. (2018). Discovering Statistics Using IBM SPSS Statistics (5th ed.). SAGE Publications.
Hayes, A. F. (2018). Introduction to Mediation, Moderation, and Conditional Process Analysis: A Regression-Based Approach (2nd ed.). The Guilford Press.
Tabachnick, B. G., & Fidell, L. S. (2019). Using Multivariate Statistics (7th ed.). Pearson.