Cronbach's Alpha in SPSS is a reliability test that measures the internal consistency of scale items in questionnaires and surveys. Learning how to calculate Cronbach's Alpha in SPSS is essential for validating Likert scales and multi-item measures in research.
This guide covers the Cronbach's Alpha formula, step-by-step calculation procedures, interpretation of SPSS output, and reliability thresholds. You'll learn when Cronbach's Alpha is acceptable (values above 0.70 for most research, though 0.50-0.60 may be acceptable for scales with fewer items).
How to calculate Cronbach's Alpha for Likert scale items is a critical skill for researchers conducting reliability analysis in SPSS.
What is Cronbach's Alpha used for?
Cronbach's Alpha is one of the most widely used reliability tests for measuring the internal consistency of ordinal or interval scale items in questionnaires. It's essential in organizational and social science research for validating measurement scales before conducting advanced analyses like mediation analysis or moderation analysis.
Understanding the Cronbach's Alpha Formula
The Cronbach's Alpha formula calculates how well a set of items measures a single underlying construct. Here is the mathematical formula:
Where:
- α = Cronbach's Alpha coefficient (ranges from 0 to 1)
- N = the number of items in the scale
- c̅ = the average covariance between item pairs
- v̅ = the average variance of all items
What does this formula tell us?
The formula essentially compares the average correlation between items (covariance) to the total variance in the scale. Higher inter-item correlations lead to higher Alpha values, indicating that items measure the same construct consistently.
Key factors affecting Cronbach's Alpha:
- Number of items (N): More items generally increase Alpha, but adding redundant items can artificially inflate it
- Inter-item correlation: Items should correlate moderately (0.30-0.70) with each other
- Scale variance: Lower variance within items can reduce Alpha values
Alternative formula (based on item correlations):
Where r̅ represents the average inter-item correlation. This version shows more clearly how the number of items and their average correlation determine reliability.
What is an "item"? In reliability analysis, an "item" refers to a single question in your questionnaire. Here's an example of a Likert scale item:
| Item | Strongly Disagree | Disagree | Neutral | Agree | Strongly Agree |
|---|---|---|---|---|---|
| I like purchasing groceries online | ☐ | ☐ | ☐ | ☐ | ☐ |
Example of a 5-point Likert scale item (1 = Strongly disagree to 5 = Strongly agree).
This example uses a 5-point Likert scale where 1 = strongly disagree; 2 = disagree; 3 = neutral; 4 = agree; and 5 = strongly agree.
Questionnaires typically contain multiple items measuring the same construct (scale variable). In statistical research, it's important to verify that items within a scale are intercorrelated - meaning they measure the same underlying concept and their values vary together.
Cronbach's Alpha coefficient ranges from 0 to 1. An Alpha above 0.70 is generally considered acceptable, with values closer to 1 indicating stronger reliability. Here's how to interpret different Alpha values:
Struggling with your statistical analysis?
We help students and researchers understand their data with SPSS, Excel, R, and Amos.
Get Expert HelpCronbach's Alpha Interpretation Table
| Cronbach's Alpha | Internal Consistency | Recommendation |
|---|---|---|
| α ≥ 0.90 | Excellent | Consider if redundancy exists; exceptional reliability may indicate repetitive items |
| α = 0.80 - 0.89 | Good | Acceptable for most academic research and applications |
| α = 0.70 - 0.79 | Acceptable | Standard threshold; suitable for new scales or exploratory studies |
| α = 0.60 - 0.69 | Questionable | Consider item revision; acceptable only in early-stage research |
| α = 0.50 - 0.59 | Poor | Revision needed; not recommended for publication |
| α < 0.50 | Unacceptable | Reject scale; complete redesign required |
Cronbach's Alpha interpretation guide for reliability analysis.
Important exception: For scales with fewer than 10 items, an Alpha value > 0.50 may be considered acceptable (Pallant, 2010), though values above 0.70 remain preferable.
For a comprehensive guide to interpreting Alpha values with real-world examples, troubleshooting steps for low or high results, and APA reporting templates, see How to Interpret Cronbach's Alpha Results.
When calculating Cronbach's Alpha in SPSS, calculate the reliability coefficient separately for each scale - don't include all scale questions in one analysis.
Example for Reliability Test in SPSS
This example uses a questionnaire measuring online purchase intention with two scale variables: consumer behavior and purchase intention. Each variable has four items measured on a 5-point Likert scale.
Goal: Calculate Cronbach's Alpha coefficient for each scale.
Practice dataset: Download the SPSS dataset from the downloads section above (dummy data for educational purposes only). Unzip the file and double-click the .sav file to open it in SPSS.
Struggling with your statistical analysis?
We help students and researchers understand their data with SPSS, Excel, R, and Amos.
Get Expert HelpHow To Calculate Cronbach's Alpha Coefficient in SPSS
The imported SPSS sample file downloaded above contains data set for 30 samples and looks like this:
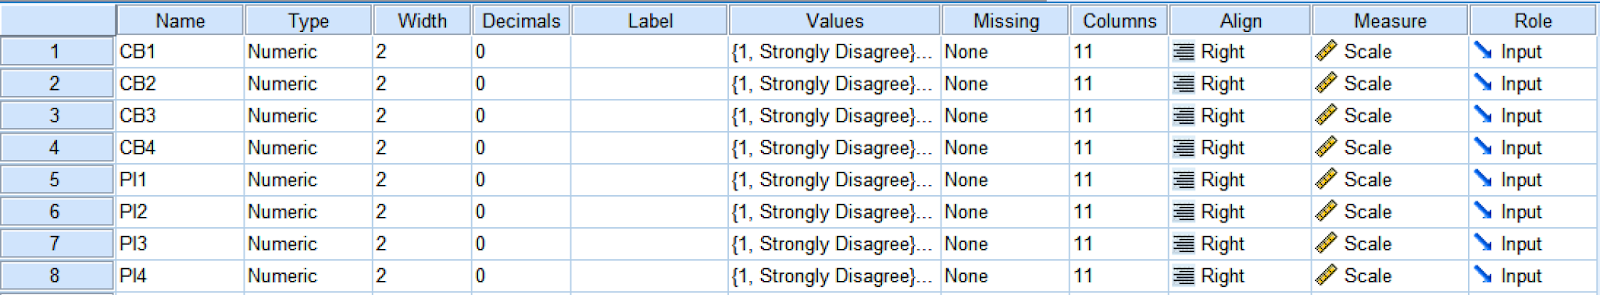 Overview of example SPSS data set with two scale variables.
The dataset contains two scales: consumer behavior (CB) with four items (CB1-CB4) and purchase intention (PI) with four items (PI1-PI4).
All items use a 5-point Likert scale where 1 = strongly disagree, 2 = disagree, 3 = neutral, 4 = agree, and 5 = strongly agree.
Your data set may be larger and contain more than two scale variables. However, the process of conducting a reliability analysis in SPSS is the same.
Step 1: On SPSS top menu, navigate to Analyze → Scale → Reliability Analysis.
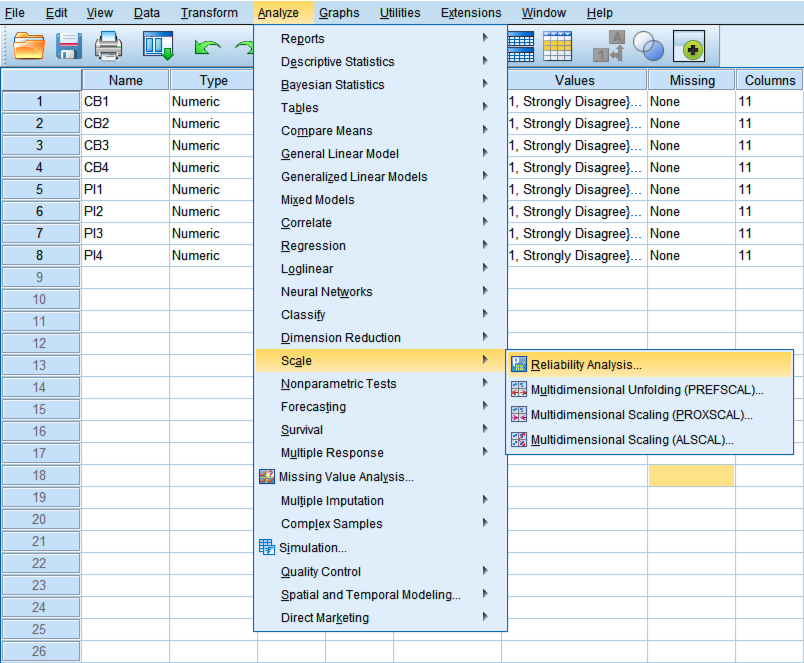 Accessing Reliability Analysis from the Analyze menu in SPSS.
Step 2: In the SPSS Reliability Analysis window, select all the items that measure a variable (e.g., consumer behavior) from the left block and use the arrow button to move them to the right.
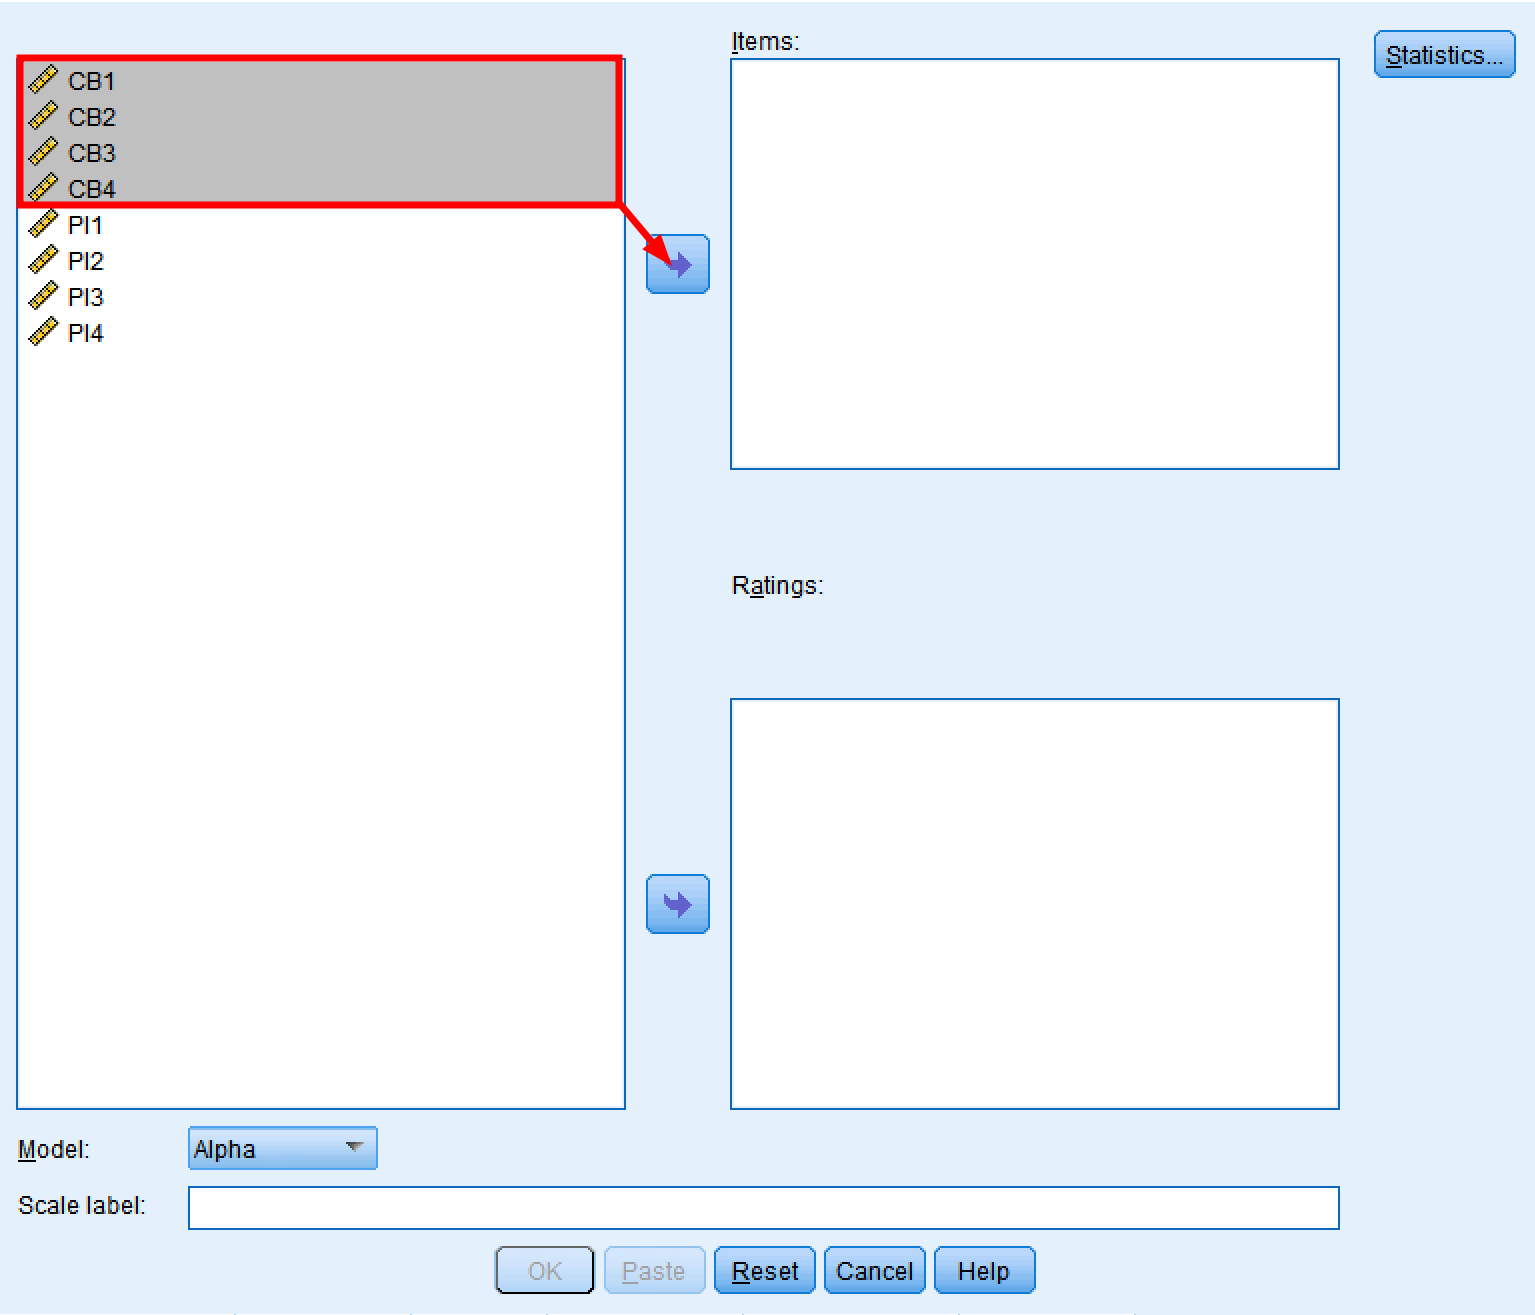 Selecting scale items (CB1-CB4) for Cronbach's Alpha reliability analysis.
Step 3: Make sure the Model selected is Alpha.
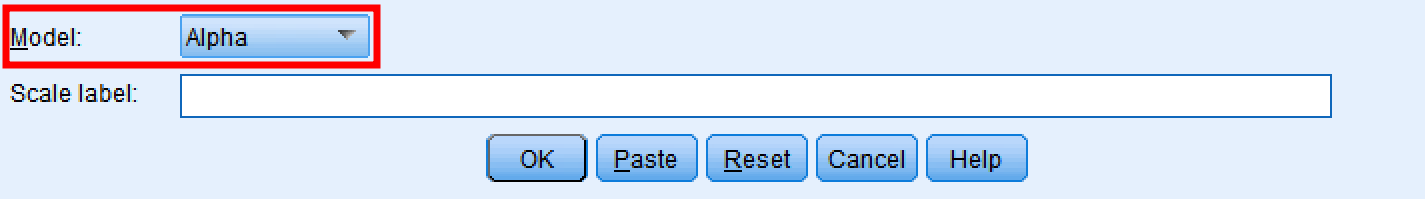 Setting the reliability model to Alpha for Cronbach's Alpha calculation.
Step 4: Type a name in the Scale label block. This step is not mandatory but can help with the interpretation of the reliability analysis results in SPSS.
 Adding a descriptive scale label for easier interpretation of results.
Step 5: Click the Statistics button. We need to select some options for the reliability analysis first.
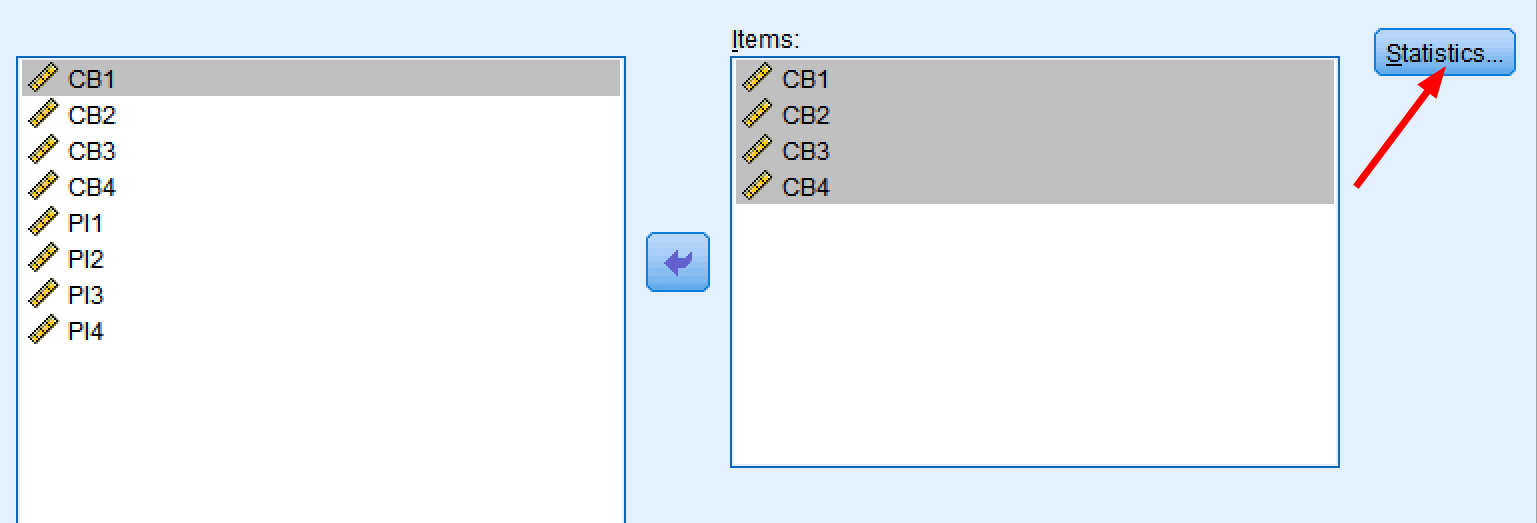 Accessing the Statistics options for detailed reliability output.
Step 6: From the Statistics tabs, select the Items, Scale, and Scale of item deleted options under the Descriptive for section. On the Summarize section select Means and Correlations. Finally, under Inter-item select Correlations. Click Continue then OK to proceed with the analysis.
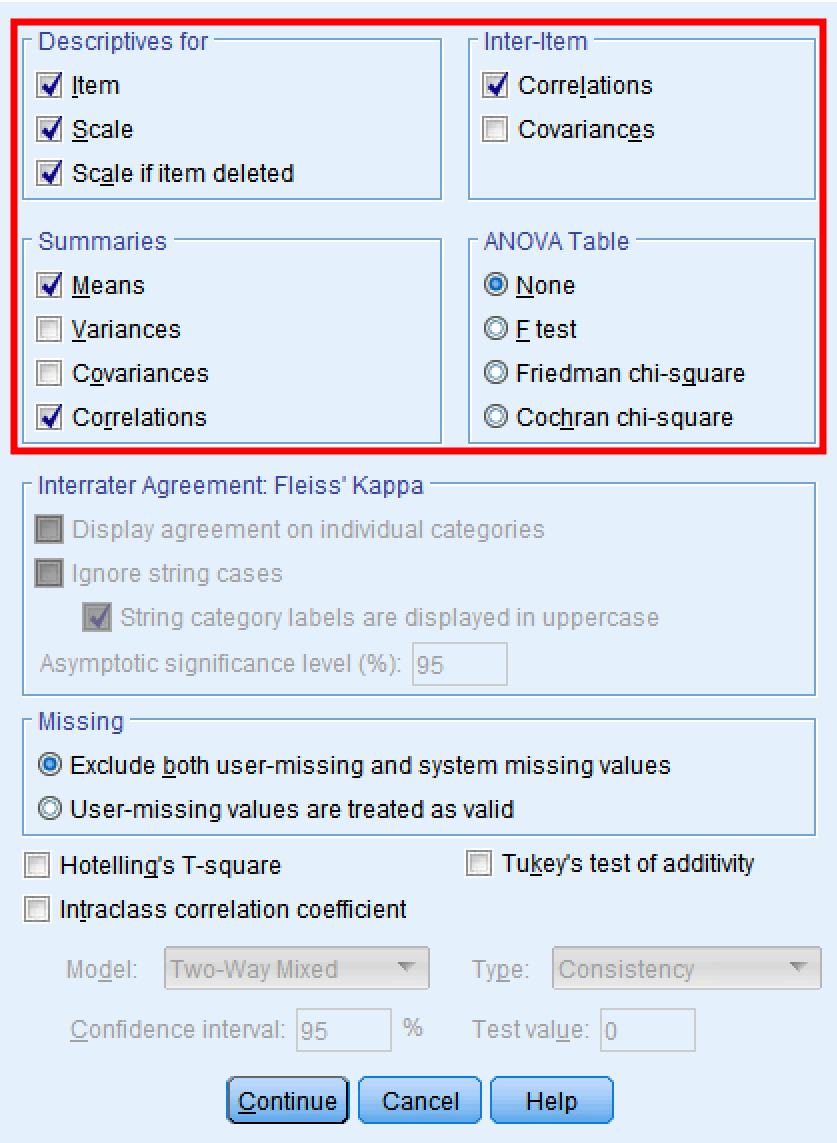 Configuring statistics options for comprehensive Cronbach's Alpha output in SPSS.
Cronbach's Alpha Results Interpretation
Alright. You should see the Alpha reliability output in a new SPSS window by now. Next, let's have a look at Cronbach's Alpha results interpretation.
Case Processing Summary
The Case Processing Summary is the first table in the reliability output that shows a summary of the cases processed in this analysis. We can observe that 30 cases were processed (N = 30 samples). We can also see that no cases were excluded (100% of the sample size was included in the analysis).
If your summary estimates are lower than 100% samples (N Valid ≠ N Total) you should check your data set for mistakes, white spaces, or (most likely) missing values.
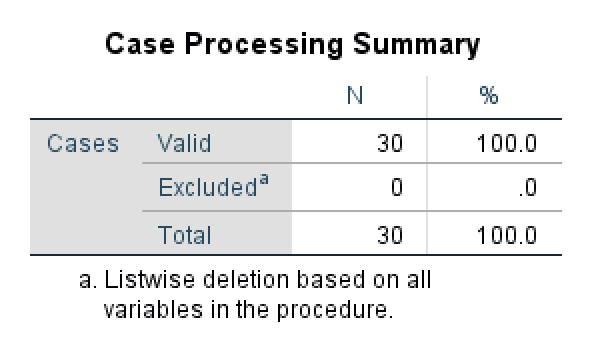 Case Processing Summary showing all 30 cases included in the reliability analysis.
Reliability Statistics
The Reliability Statistics table shows us the reliability Alpha coefficient for all items included in the analysis. In our example, the Alpha value is 0.904 (> 0.7) which is interpreted as excellent.
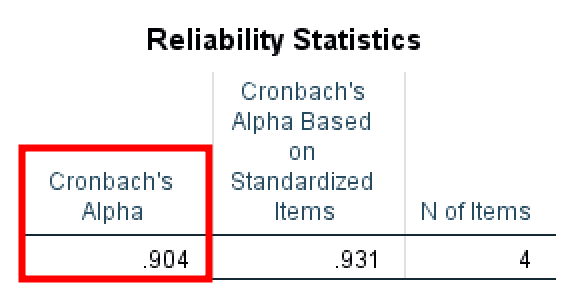 Reliability Statistics table showing excellent Cronbach's Alpha of 0.904.
It is important to keep in mind that if you have fewer than 10 items on the scale it is quite difficult to get a high Alpha value. In such cases, an Alpha value > 0.5 is considered acceptable (Pallant, 2010). Values lower than < 0.5 should be a cause for concern in such cases.
Item Statistics
The Item Statistics table provides information about the Mean, Standard Deviation, and the number of samples (N) for each of the items on the scale. The mean represents an average of the values in the data set and can be useful when analyzing descriptive statistics or frequencies in our study.
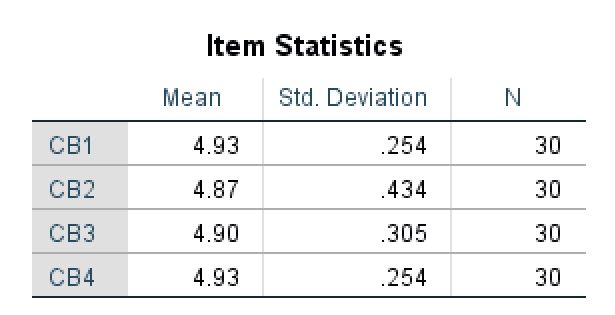 Item Statistics showing descriptive statistics for each scale item.
Inter-Item Correlation Matrix
The Inter-Item Correlation Matrix shows us how items in the scale correlate with each other. The maximum value here is 1.000 when an item is correlated with itself in a matrix. A high correlation value shows a strong correlation between two items on a scale.
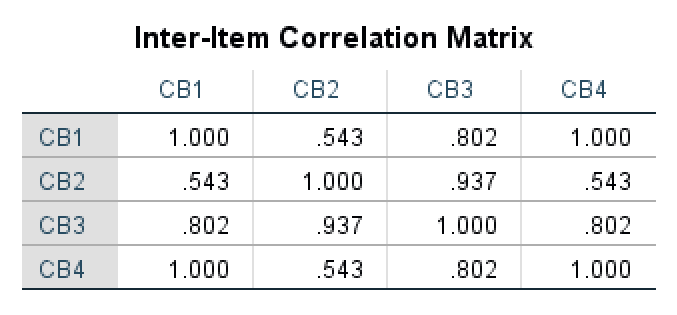 Inter-Item Correlation Matrix showing relationships between scale items.
In our example, we can see that CB2 and CB3 items are highly correlated (0.937) indicating a strong relationship. In contrast, the correlation between CB4 and CB2 (0.543) is not that strong indicating a weaker relationship between these items.
Summary Item Statistics
The Summary Item Statistics table shows us the mean for all items in the scale and how these items are intercorrelated. It also outputs the range of the means calculated as the difference between a maximum and minimum values.
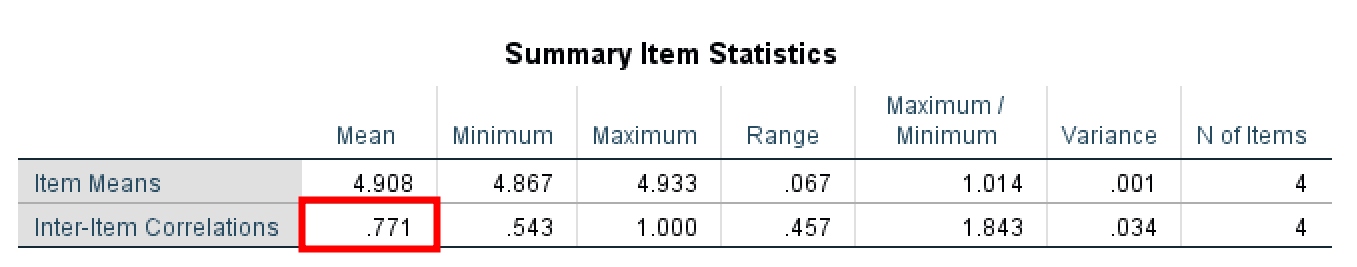 Summary Item Statistics displaying inter-item correlation mean of 0.771.
If you have a low inter-item correlation coefficient for the mean (< 0.5) due to low numbers of items on the scale is important to report it in your analysis (Pallant, 2010). In our case, the inter-item correlation mean is 0.771 (> 0.7) therefore acceptable.
Item-Total Statistics
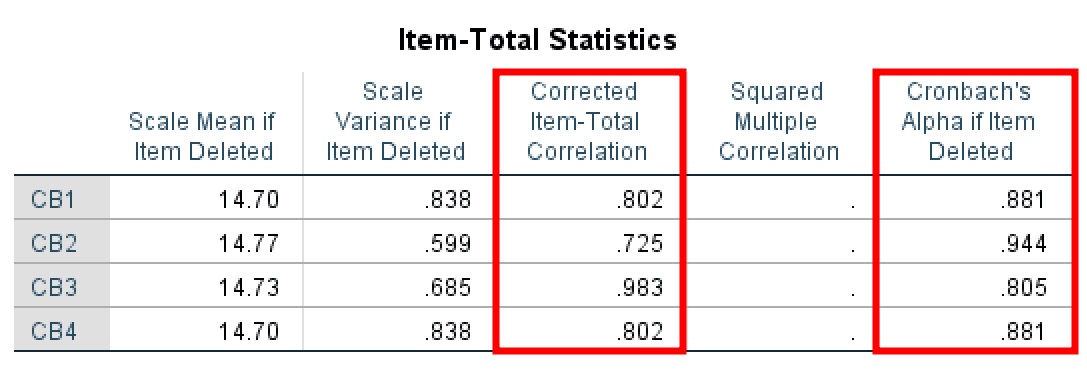
The Item Total Statistics table presents the scale mean and variance if specific items are deleted, the total correlation for corrected items, the square multiple correlations, and the value of Cronbach's Alpha if an item is deleted.
 Item-Total Statistics for identifying problematic items in the scale.
Let's look first at the Corrected item – Total Correlation column. The values here represent the correlation for each item with the rest of the items combined. For instance, item CB1 (0.802) correlation with items CB2, CB3, CB4; item CB2 correlation with item CB1, CB3, and CB4; and so on. You should aim at values > 0.40 here.
Next, let's analyze the Cronbach's Alpha if Item Deleted column. This is important when dealing with poor Alpha scores and we want to identify which item is the cause for it. This column tells us if an item is deleted what would be the resulting Alpha value.
Scale Statistics
Finally, the Scale Statistics table shows the mean, variance, and standard deviation calculated for the whole scale.
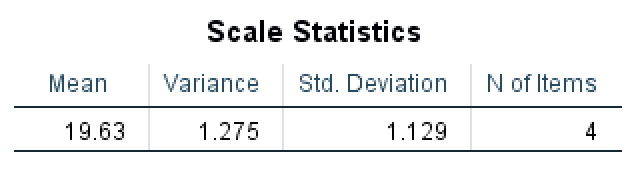 Scale Statistics showing overall descriptive statistics for the complete scale.
Now go ahead and exercise what you've learned by running a reliability test in SPSS for the second scale variable in our example: purchase intention.
Did it pass the reliability Alpha test?
Frequently Asked Questions
Wrapping Up
Reliability analysis is essential in statistical research and serves as an assumption for advanced analyses like linear regression. Alpha values above 0.70 indicate acceptable reliability. If your Alpha is below this threshold, check the Item-Total Statistics table to identify problematic items.
You now know how to calculate Cronbach's Alpha in SPSS, interpret the output, and assess scale reliability for your research.
Don't have SPSS? You can also calculate Cronbach's Alpha in Excel using a formula-based approach.
References
Bonett, D. G., & Wright, T. A. (2015). Cronbach's Alpha Reliability Interval Estimation, Hypothesis Testing, and Sample Size Planning.
Cronbach, L. J. (1951). Coefficient alpha and the internal structure of tests. Psychometrika, 16, 297-334 (28,307 citations in Google Scholar as of 4/1/2016).
Pallant, Julie. SPSS Survival Manual: A Step by Step Guide to Data Analysis Using SPSS. Maidenhead: Open University Press/McGraw-Hill, 2010.