Learning how to calculate percent difference in R is essential for data analysis and statistical computing. Whether you need to compare sales figures, track performance changes, or analyze experimental results, R provides straightforward methods to calculate percentage difference between two numbers.
This guide shows you how to calculate percentage difference in R using two practical approaches: creating a custom function with the percentage difference formula, and using the scales package for professional formatting. By the end, you'll know exactly how to find percentage difference for any dataset in R.
What is the Percentage Difference?
The percentage difference is a measure of the change between two values, expressed as a percentage of the original value, and is calculated using the following formula:
To illustrate this concept, let's consider a company example. If sales in the first quarter were 5,000 dollars, and sales in the second quarter were 7,500 dollars, then the percentage difference is calculated as follows:
-
Subtract the old value from the new value: $7,500 – $5,000 = $2,500
-
Divide the result by the old value: $2,500 / $5,000 = 0.5
-
Multiply the result by 100 to get the percentage value: 0.5 × 100 = 50%
This means that the sales in the second quarter were 50% higher than in the first quarter. The percentage difference helps us to understand the change between the two values and provides a useful measure to track and compare performance over time.
How to Calculate Percentage Difference in R
To calculate the percentage difference between two values in R, you can define a custom function that uses the formula ((new - old) / old) * 100 with the syntax shown below:
percent_diff <- function(old_value, new_value) {

  ((new_value - old_value) / old_value) * 100

}
Here's an example of how to define and use the above function:
sales <- data.frame(month = c("January", "February"), sales = c(2500, 4000))
percent_diff(sales$sales[1], sales$sales[2])
This should give you the percentage difference between the two sales figures in the sales data frame, respectively 60%.
How to Calculate Percentage Difference Between Two Numbers in R
For quick calculations between two numbers, you can apply the percentage difference formula directly in R without creating a function. Here's how to calculate percent difference between two values:
# Calculate percentage difference between two numbers
old_value <- 100
new_value <- 150

# Apply the formula: ((new - old) / old) * 100
percentage_diff <- ((new_value - old_value) / old_value) * 100
print(percentage_diff)  # Output: 50
This approach is useful when you need a one-time calculation. The result shows that 150 is 50% higher than 100.
For multiple comparisons, you can use R's vectorization to calculate percentage differences for entire datasets:
# Calculate percentage difference for vectors
old_values <- c(100, 200, 300)
new_values <- c(120, 180, 330)

percentage_changes <- ((new_values - old_values) / old_values) * 100
print(percentage_changes)  # Output: 20, -10, 10
This method efficiently processes multiple value pairs simultaneously, making it ideal for large datasets.
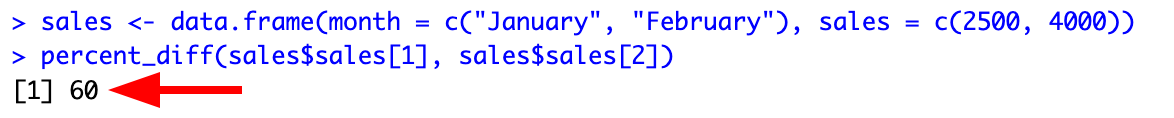 Custom function calculating 60% percentage difference between sales values
Another way to calculate the percentage difference in R is by using thepercent()function to convert a decimal number into a percentage. To use thepercent()function, we must first install thescalespackage using the following command:
install.packages("scales")Once the package is installed, you can load it into your R session using the**library()**function:
library(scales)And finally, here's an example of how to use thepercent()function to calculate the percentage difference in R between an old and new value:
old_value <- 10
new_value <- 15
percent((new_value - old_value) / old_value)
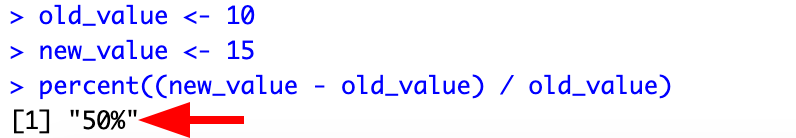 Using scales package percent() function to format percentage difference
This means the new value is 50% higher than the old one.
Percentage Difference Formula Explained
The percentage difference formula ((new - old) / old) * 100 calculates the relative change between two values. The numerator (new - old) represents the absolute change, while dividing by the old value normalizes this change relative to the starting point. Multiplying by 100 converts the decimal result into a percentage.
Key Components:
- New value: The more recent or updated measurement
- Old value: The original or baseline measurement
- Result: Positive percentages indicate increase, negative indicate decrease
This formula is widely used in finance, statistics, and data analysis to quantify relative changes across different scales and units.
When to Use Percentage Difference
Percentage difference is most appropriate when:
Use Percentage Difference:
- Comparing values across different scales or units
- Tracking growth or decline over time
- Analyzing financial performance (revenue, costs, profits)
- Evaluating experimental changes relative to a baseline
- Communicating relative changes to non-technical audiences
Avoid When:
- Comparing percentages themselves (use percentage point difference)
- The old value is zero (results in division by zero)
- Absolute differences are more meaningful than relative ones
- Negative values make interpretation ambiguous
In R, percentage difference calculations streamline comparative analysis workflows and enable automated reporting of relative changes across datasets.
Percentage Difference vs Percentage Change
While often used interchangeably, percentage difference and percentage change have subtle distinctions:
Percentage Difference:
- Compares two independent values
- No temporal implication
- Example: Comparing prices between two stores
Percentage Change:
- Measures change over time
- Emphasizes progression from baseline
- Example: Tracking monthly revenue growth
Both use the same formula ((new - old) / old) * 100, but percentage change specifically indicates temporal progression. In R, the calculation method remains identical regardless of terminology.
Frequently Asked Questions About Percentage Difference in R
Wrapping Up
Calculating percentage differences in R is straightforward using either custom functions or the scales package. Custom functions provide flexibility for specific workflows, while the scales package offers professional formatting for reports and visualizations.
The percentage difference formula ((new - old) / old) * 100 quantifies relative changes across any numerical data. Whether analyzing financial metrics, experimental results, or performance indicators, R provides efficient tools to compute and communicate percentage differences effectively.
For further statistical analysis in R, explore related topics including standard error calculations, percentage to decimal conversions, and advanced data manipulation techniques.