If you've ever wondered how to perform a t-test in Excel, you're in the right place! This comprehensive guide will walk you through the t-test formula in Excel for all three types: One-Sample t-test, Independent Samples t-test, and Paired t-test.
Whether you're analyzing research data, comparing test scores before and after a study, or determining if two groups differ significantly, this tutorial will show you how to calculate t-test in Excel step-by-step.
Practice dataset available: Download the T-test Excel template from the downloads section in the sidebar to follow along with real examples.
What You'll Learn:
- How to use the T.TEST function in Excel
- Step-by-step instructions for all 3 t-test types
- How to interpret p-values and statistical significance
- When to use Equal vs. Unequal Variances
Let's dive into performing t-tests in Excel!
How to Perform One-Sample T-Test in Excel
Step 1: Prepare Your Dataset for One-Sample T-Test
A one-sample t-test compares the mean of a single sample against a known value (hypothesized mean). In this example, we'll test if student heights differ significantly from 170 cm.
To set up your data:
- Open Excel and enter your sample data in column A (e.g., student heights)
- Create a "Dummy" column in column B
- Fill all cells in column B with your hypothesized value (170)
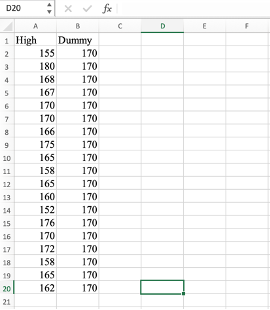 Dataset setup for one-sample t-test with sample data in column A and hypothesized value (170) in column B.
Step 2: Use the T.TEST Formula for One-Sample T-Test
Hypotheses:
- H0 (Null Hypothesis): μ equals 170
- H1 (Alternative Hypothesis): μ ≠ 170
Excel T.TEST Formula Syntax:
=T.TEST(array1, array2, tails, type)Parameters:
array1: Your sample data range (A2:A20)array2: Dummy column with hypothesized mean (B2:B20)tails: 1 for one-tailed test, 2 for two-tailed testtype: 1 for paired, 2 for equal variance, 3 for unequal variance
Example Formula:
=T.TEST(A2:A20, B2:B20, 2, 1)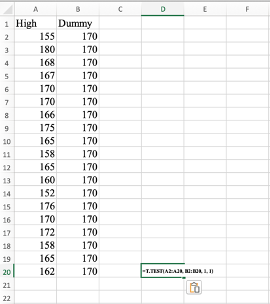 The T.TEST formula entered in Excel showing the syntax: =T.TEST(A2:A20, B2:B20, 2, 1).
Step 3: Interpret the T-Test Results
The formula returns a p-value (e.g., 0.01429).
How to interpret:
- If p-value < 0.05: Reject H0 → statistically significant difference
- If p-value ≥ 0.05: Fail to reject H0 → no significant difference
In this example, p equals 0.01429 which is less than 0.05, so we reject the null hypothesis. The sample mean is statistically different from 170 cm.
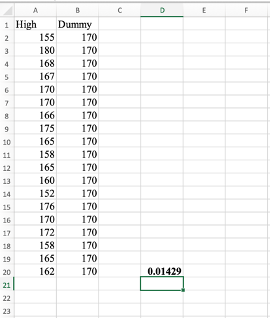 P-value result of 0.01429 shown in Excel, indicating statistical significance.
Independent Samples T-Test in Excel (Two-Sample)
Step 1: Organize Your Data by Groups
An independent samples t-test compares the means of two separate groups. In this example, we'll compare heights between males and females.
Setup:
- Column A: Female heights
- Column B: Male heights
- Ensure each group is in a separate column
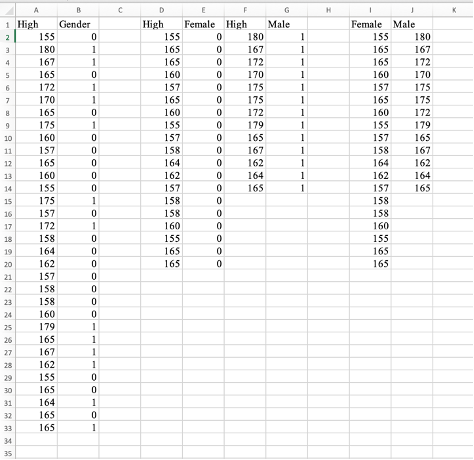 Two-sample data organized with female heights in column A and male heights in column B.
Step 2: Open Data Analysis Toolpak
Go to Data tab → Data Analysis → Select "t-Test: Two-Sample Assuming Unequal Variances" → Click OK.
Why Unequal Variances? We assume the two groups have different variances (spread), which is safer when you're unsure about variance equality.
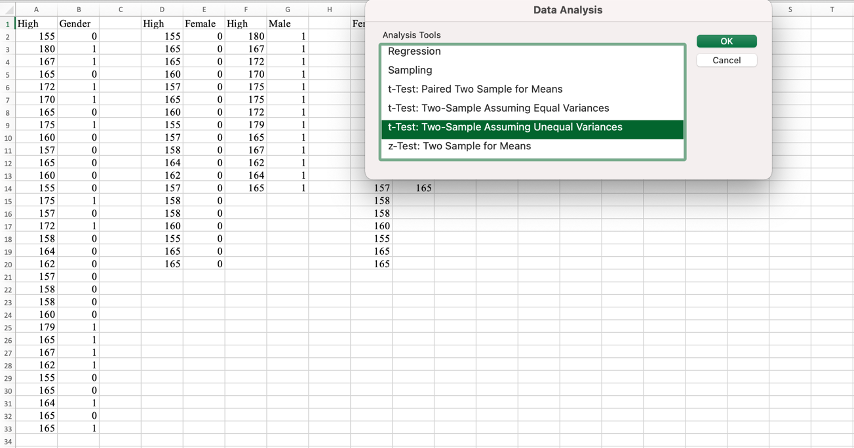 Data Analysis menu showing the t-Test: Two-Sample Assuming Unequal Variances option selected.
Step 3: Configure the T-Test Settings
In the dialog box:
- Variable 1 Range: Select female height data (including label)
- Variable 2 Range: Select male height data (including label)
- Hypothesized Mean Difference: Leave at 0
- Check "Labels" box
- Click OK
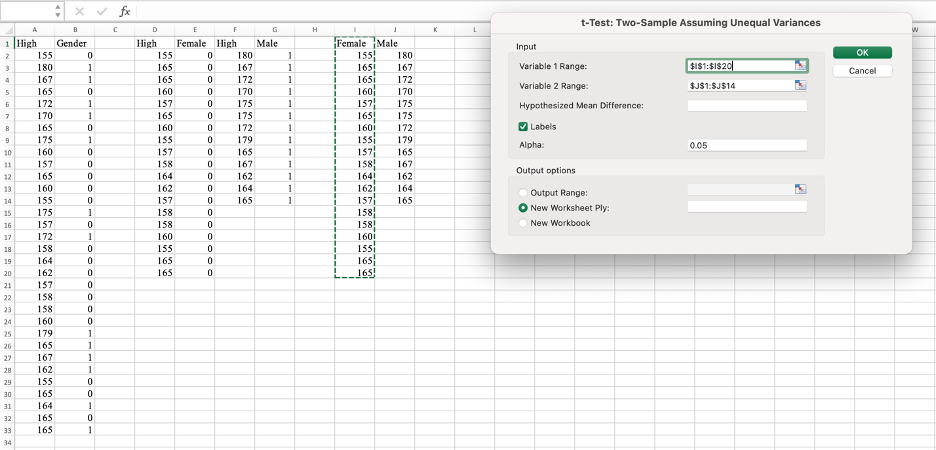 T-test dialog box configured with Variable 1 and Variable 2 ranges, and Labels checkbox selected.
Step 4: Interpret Independent T-Test Results
Excel outputs a detailed results table showing:
- Female Mean: 160.65
- Male Mean: 170.23
- P(T less than or equal to t) two-tail: 0.0000236 (p-value)
Interpretation: Since p equals 0.0000236 (less than 0.05), we reject H0. There's a statistically significant difference in average height between males and females.
Hypotheses:
- H0: μ₁ equals μ₂ (no difference in means)
- H1: μ₁ ≠ μ₂ (significant difference exists)
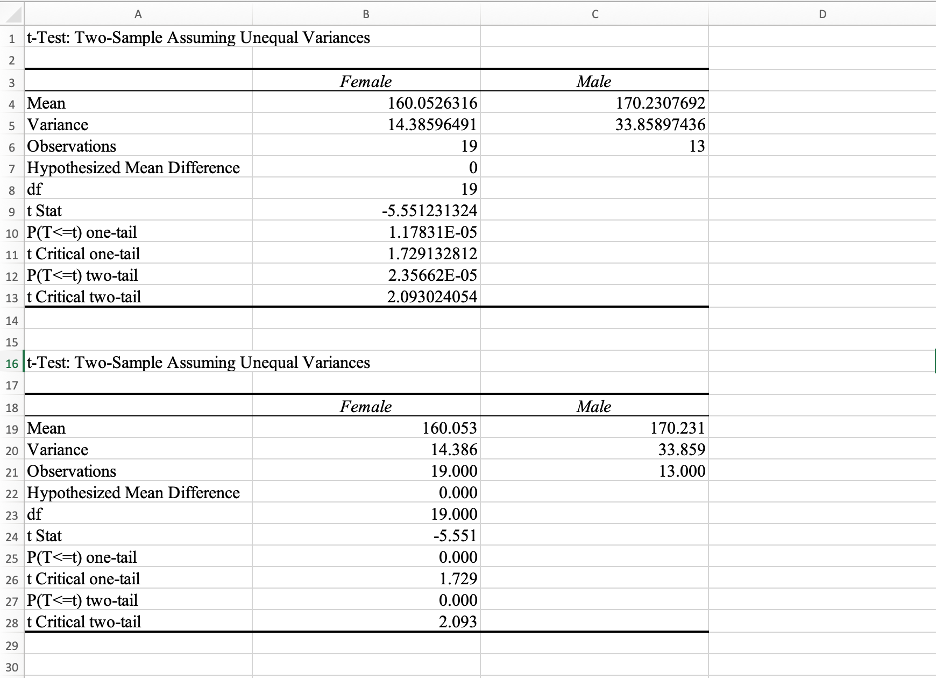 Excel output table showing means for both groups and p-value of 0.0000236, indicating highly significant difference.
Paired Sample T-Test in Excel (Before-After Comparison)
Step 1: Prepare Paired Data
A paired t-test compares two related measurements from the same group (e.g., test scores before and after studying).
Setup:
- Column A: "Before Study" scores
- Column B: "After Study" scores
- Each row represents the same person's scores
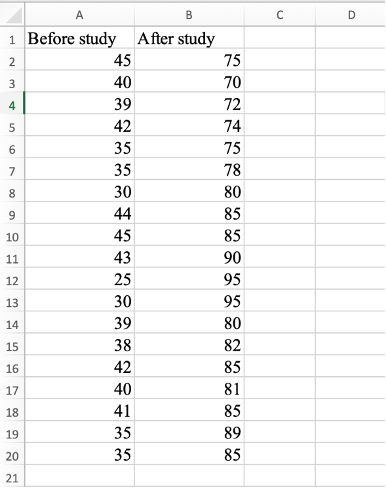 Paired data organized with "Before Study" scores in column A and "After Study" scores in column B.
Step 2: Select Paired Two Sample for Means
Go to Data → Data Analysis → "t-Test: Paired Two Sample for Means" → Click OK.
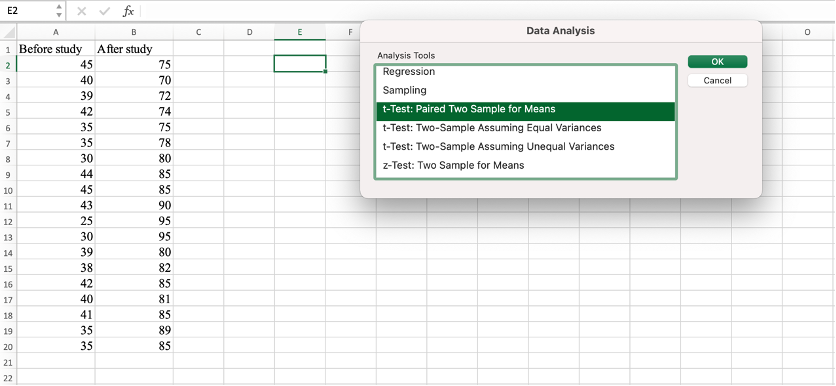 Data Analysis menu with t-Test: Paired Two Sample for Means option highlighted.
Step 3: Configure Paired T-Test
In the dialog box:
- Variable 1 Range: Select "Before Study" scores (with label)
- Variable 2 Range: Select "After Study" scores (with label)
- Hypothesized Mean Difference: 0
- Check "Labels"
- Click OK
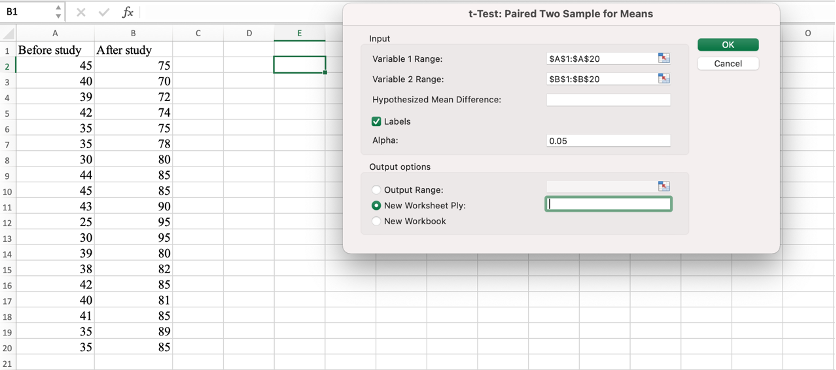 Paired t-test dialog box with Variable 1 and Variable 2 ranges selected and Labels option checked.
Step 4: Interpret Paired T-Test Results
Results show:
- P(T less than or equal to t) two-tail: 0.000 (p-value < 0.001)
Interpretation: Since p < 0.05, we reject H0. There's a statistically significant improvement in test scores after studying.
Hypotheses:
- H0: μ_difference equals 0 (no change before/after)
- H1: μ_difference ≠ 0 (significant change)
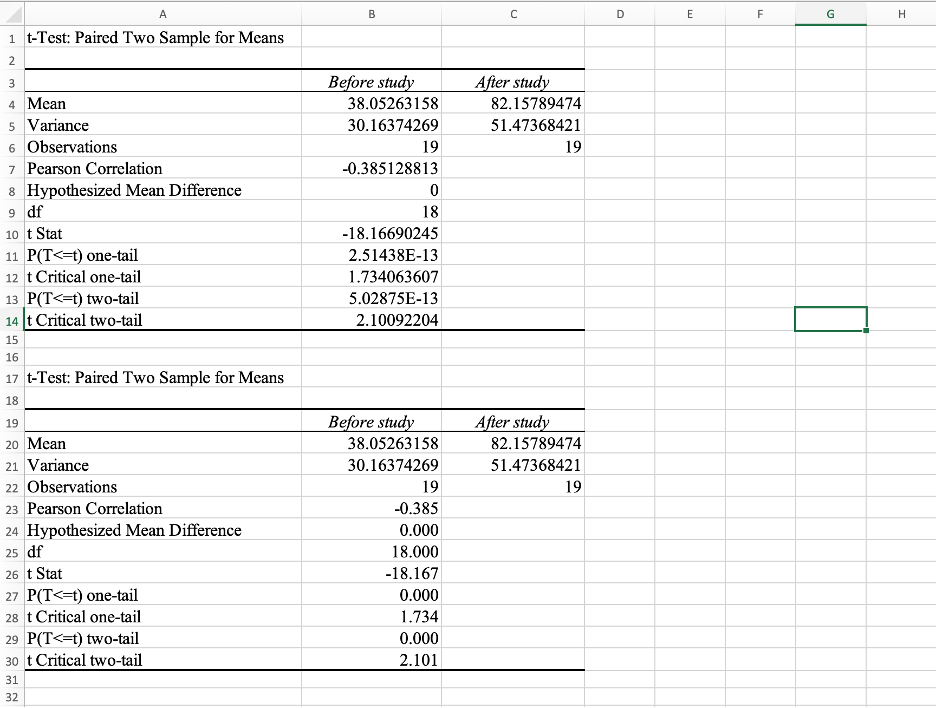 Excel results table showing p-value less than 0.001, confirming significant improvement in test scores.
Frequently Asked Questions
Wrapping Up
In this tutorial, you learned how to perform all 3 types of t-tests in Excel:
- One-Sample T-Test: Compare a sample mean to a known value (e.g., average height vs. 170 cm)
- Independent Samples T-Test: Compare means of two separate groups (e.g., male vs. female heights)
- Paired Sample T-Test: Compare means of the same group measured twice (e.g., before vs. after study)
Key Takeaways:
- p-value < 0.05 means statistically significant difference
- Enable Data Analysis Toolpak before using advanced t-tests
- Choose Equal/Unequal Variances based on your data characteristics
- Use T.TEST formula for quick calculations
You can now perform t-tests in Excel with confidence, interpret results correctly, and present findings professionally.